RD Mapa map to explore rare disease
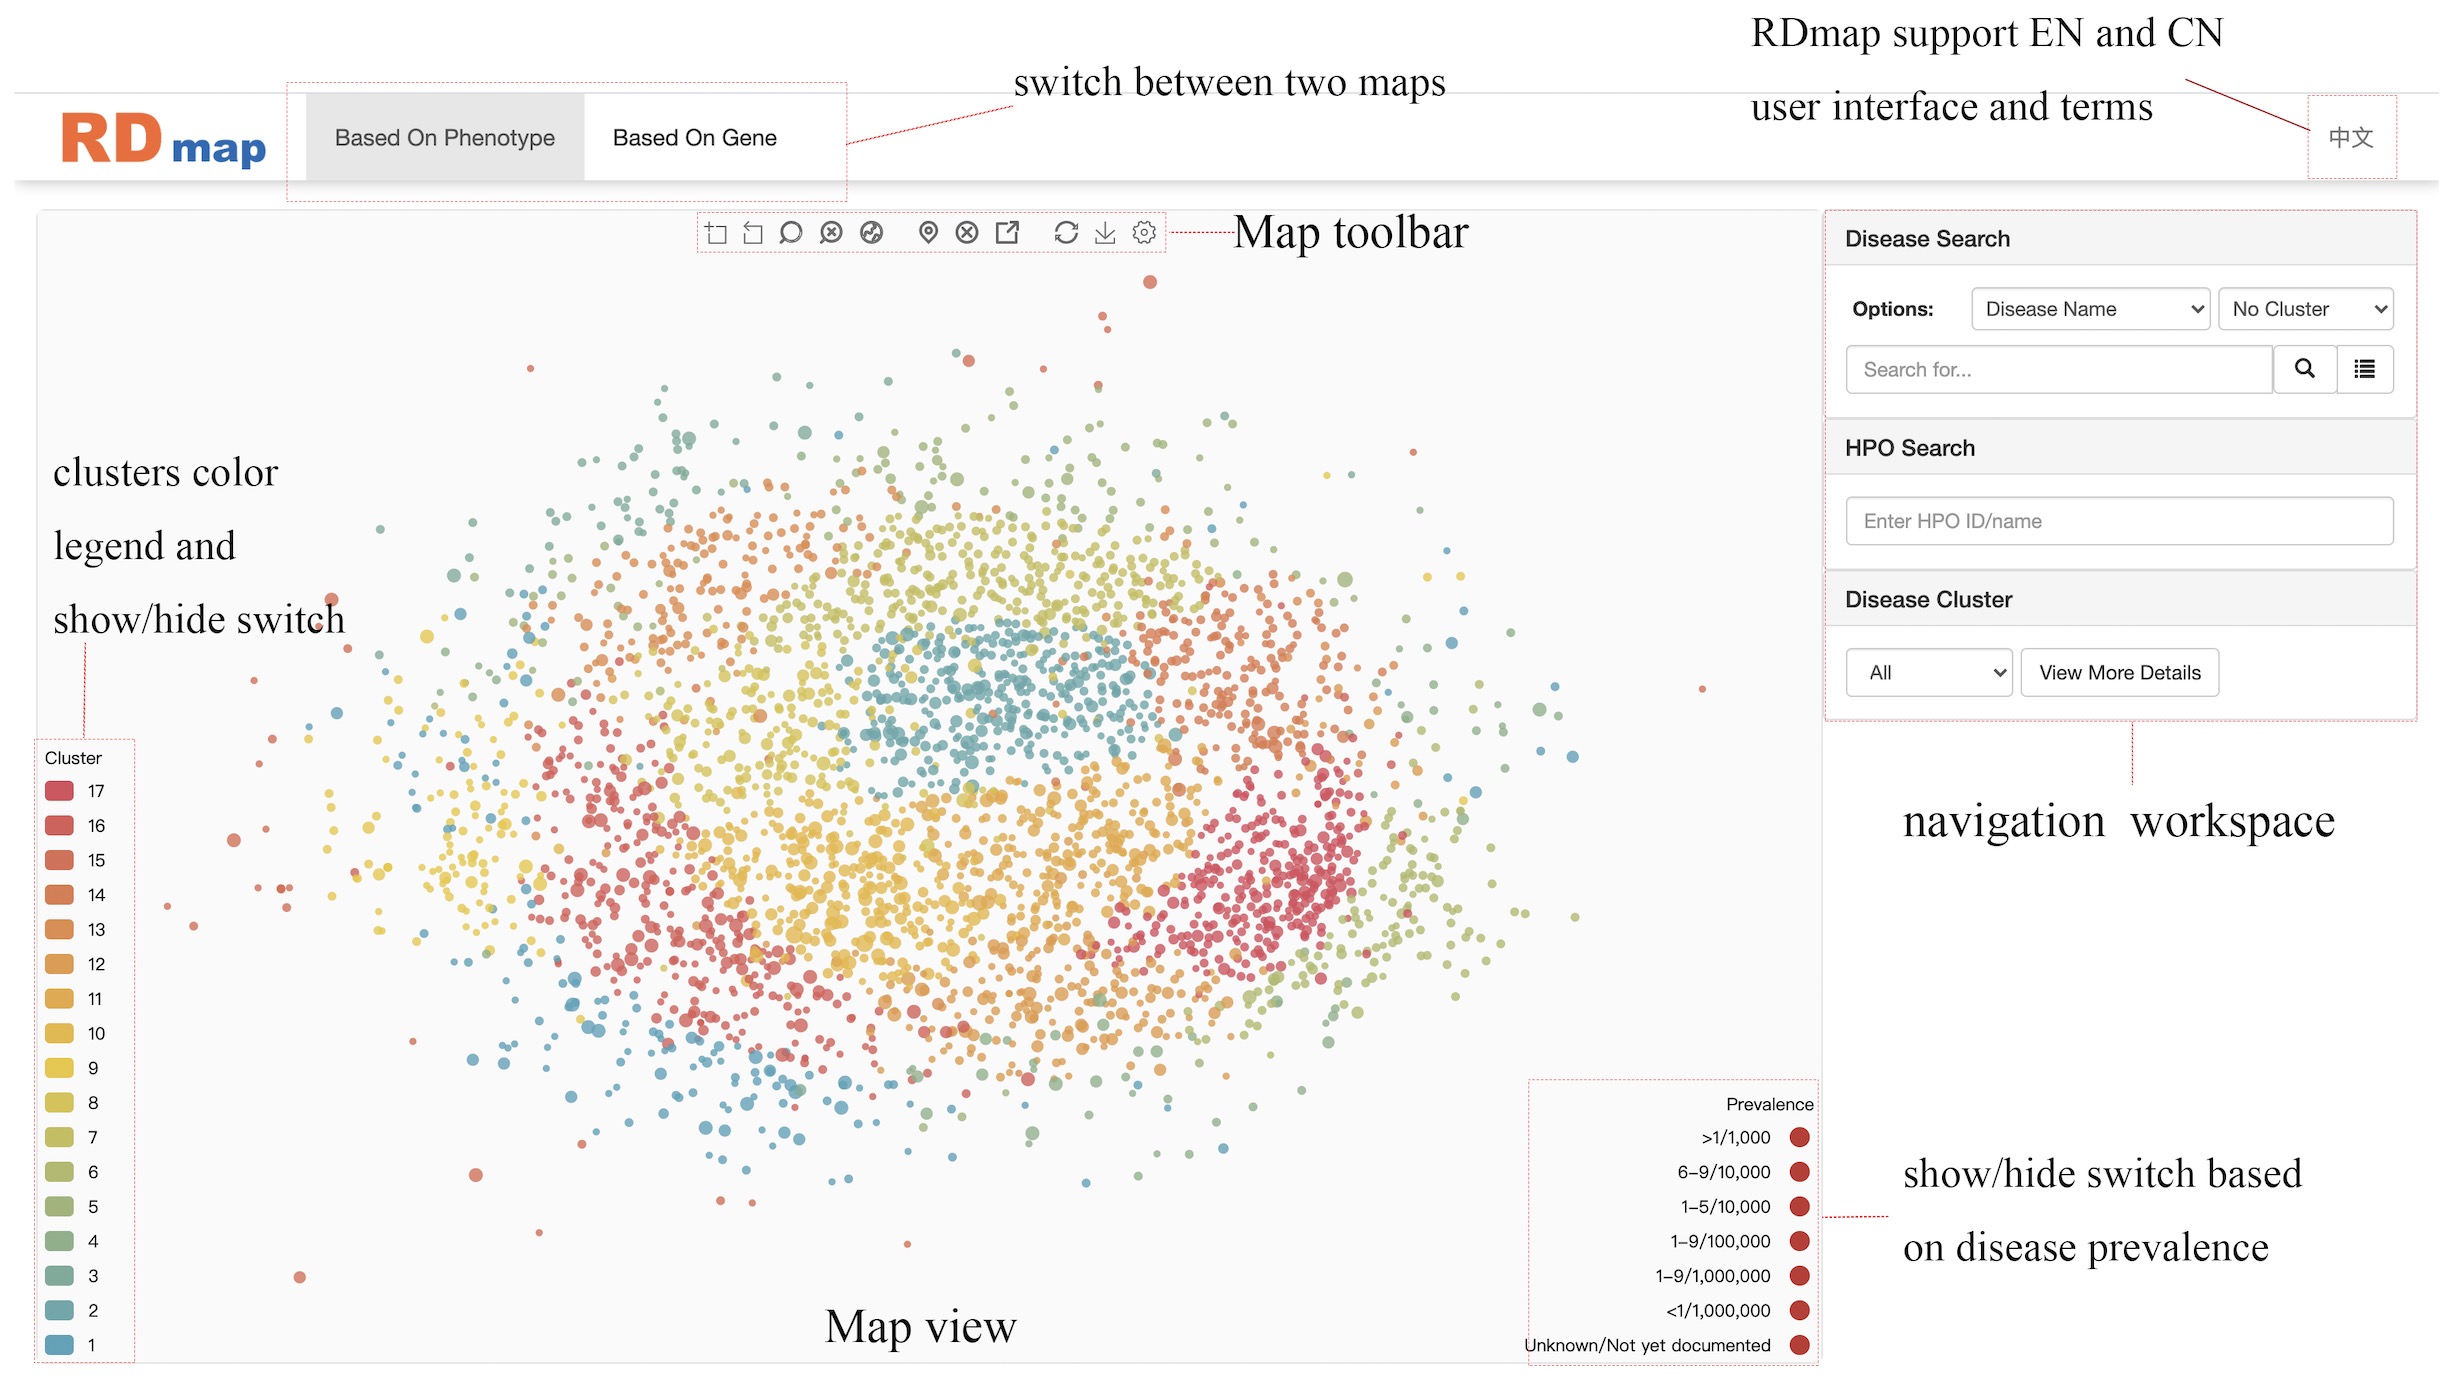

region zoom used to zoom into a region selected by mouse.

region zoom restore used to restore the view before last region zoom, it supports multiple steps restore.

mouse zoom will allow user to zooming and panning by mouse.

cancel mouse zoom will disable the mouse zooming and panning events.

show the whole map will restore map view to the default size.

localize selected disease the map will show the selected disease in the zoom in center of view.

deselect disease it used to deselect the selected disease which will be highlighted when selected by mouse click.

jump to gene-based map or jump to phenotype-based map it works only when there is a disease selected and user can jump to another map and localize the same disease. When the selected disease not included in another map there will be a message box.

restore map will show the whole map and without clusters information

save as image will save current map view as a local image file.

map setting will open the following Rare Disease Map Options dialogue box to configure the map by user.
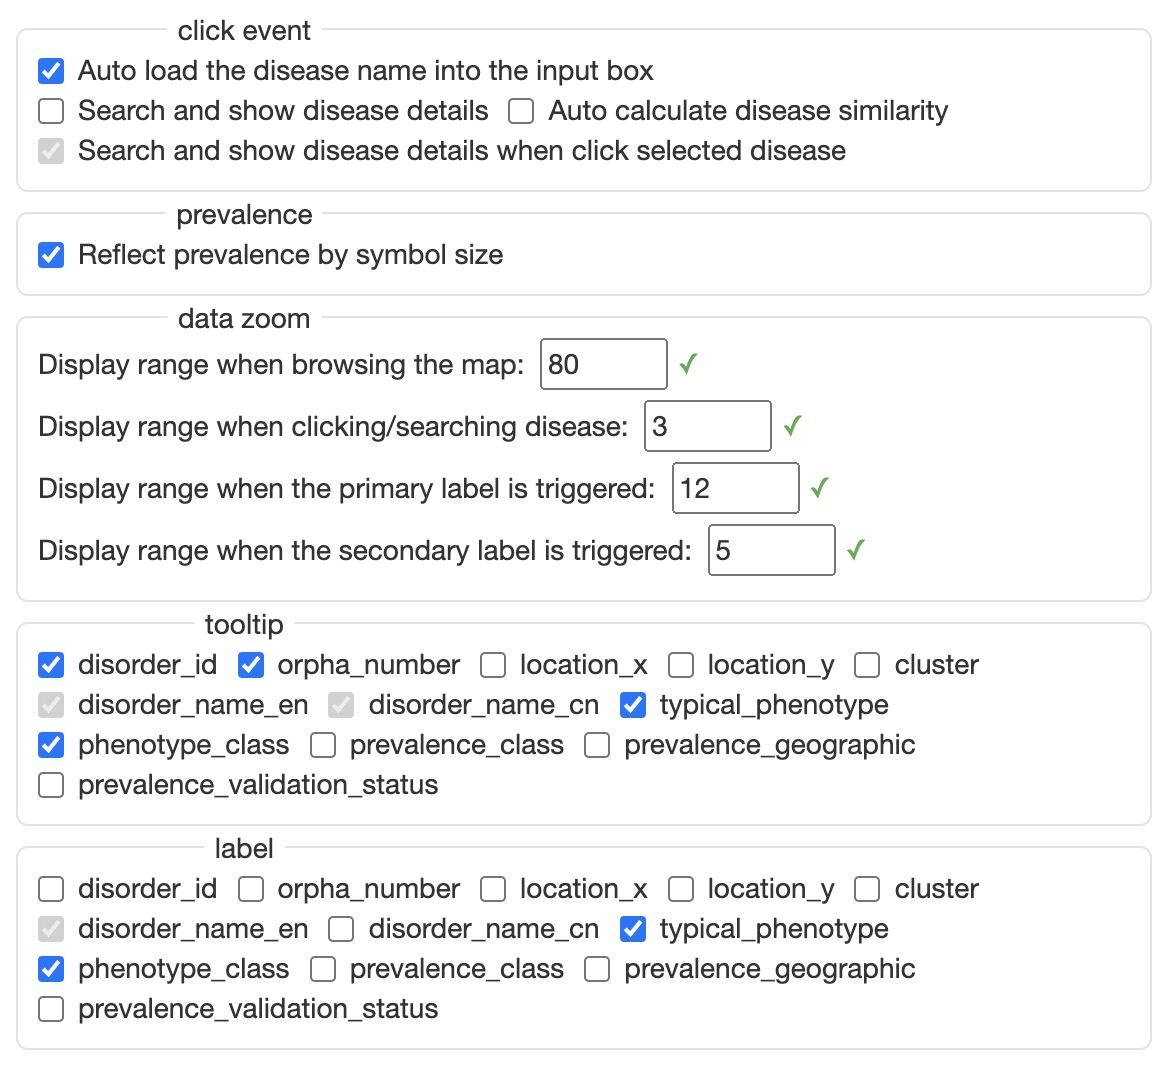
In this setting, user can configure the mouse click events, whether using the symbol size to reflect prevalence, the default zoom status on different condition, the information will be show on the map. The primary label and secondary label will be shown based on the configured zoom status.
When the user clicks on a common disease point, click event will be triggered, and the disease point will be selected. When the user clicks on a selected disease point, detailed information about the disease will be displayed---Disease Content module.
The default click event is just load the disease name into the Disease Search input box. If you want to learn disease information when click on the disease point, please set it in the click event of Rare Disease Map Options first.
The adjustment range of data zoom is 0-100. The smaller the number set, the smaller the map range when the corresponding event is triggered.
tooltip controls the prompt information displayed when the mouse moves to the disease point.
label controls the information displayed by the secondary label. The primary label only displays the disease name by default.
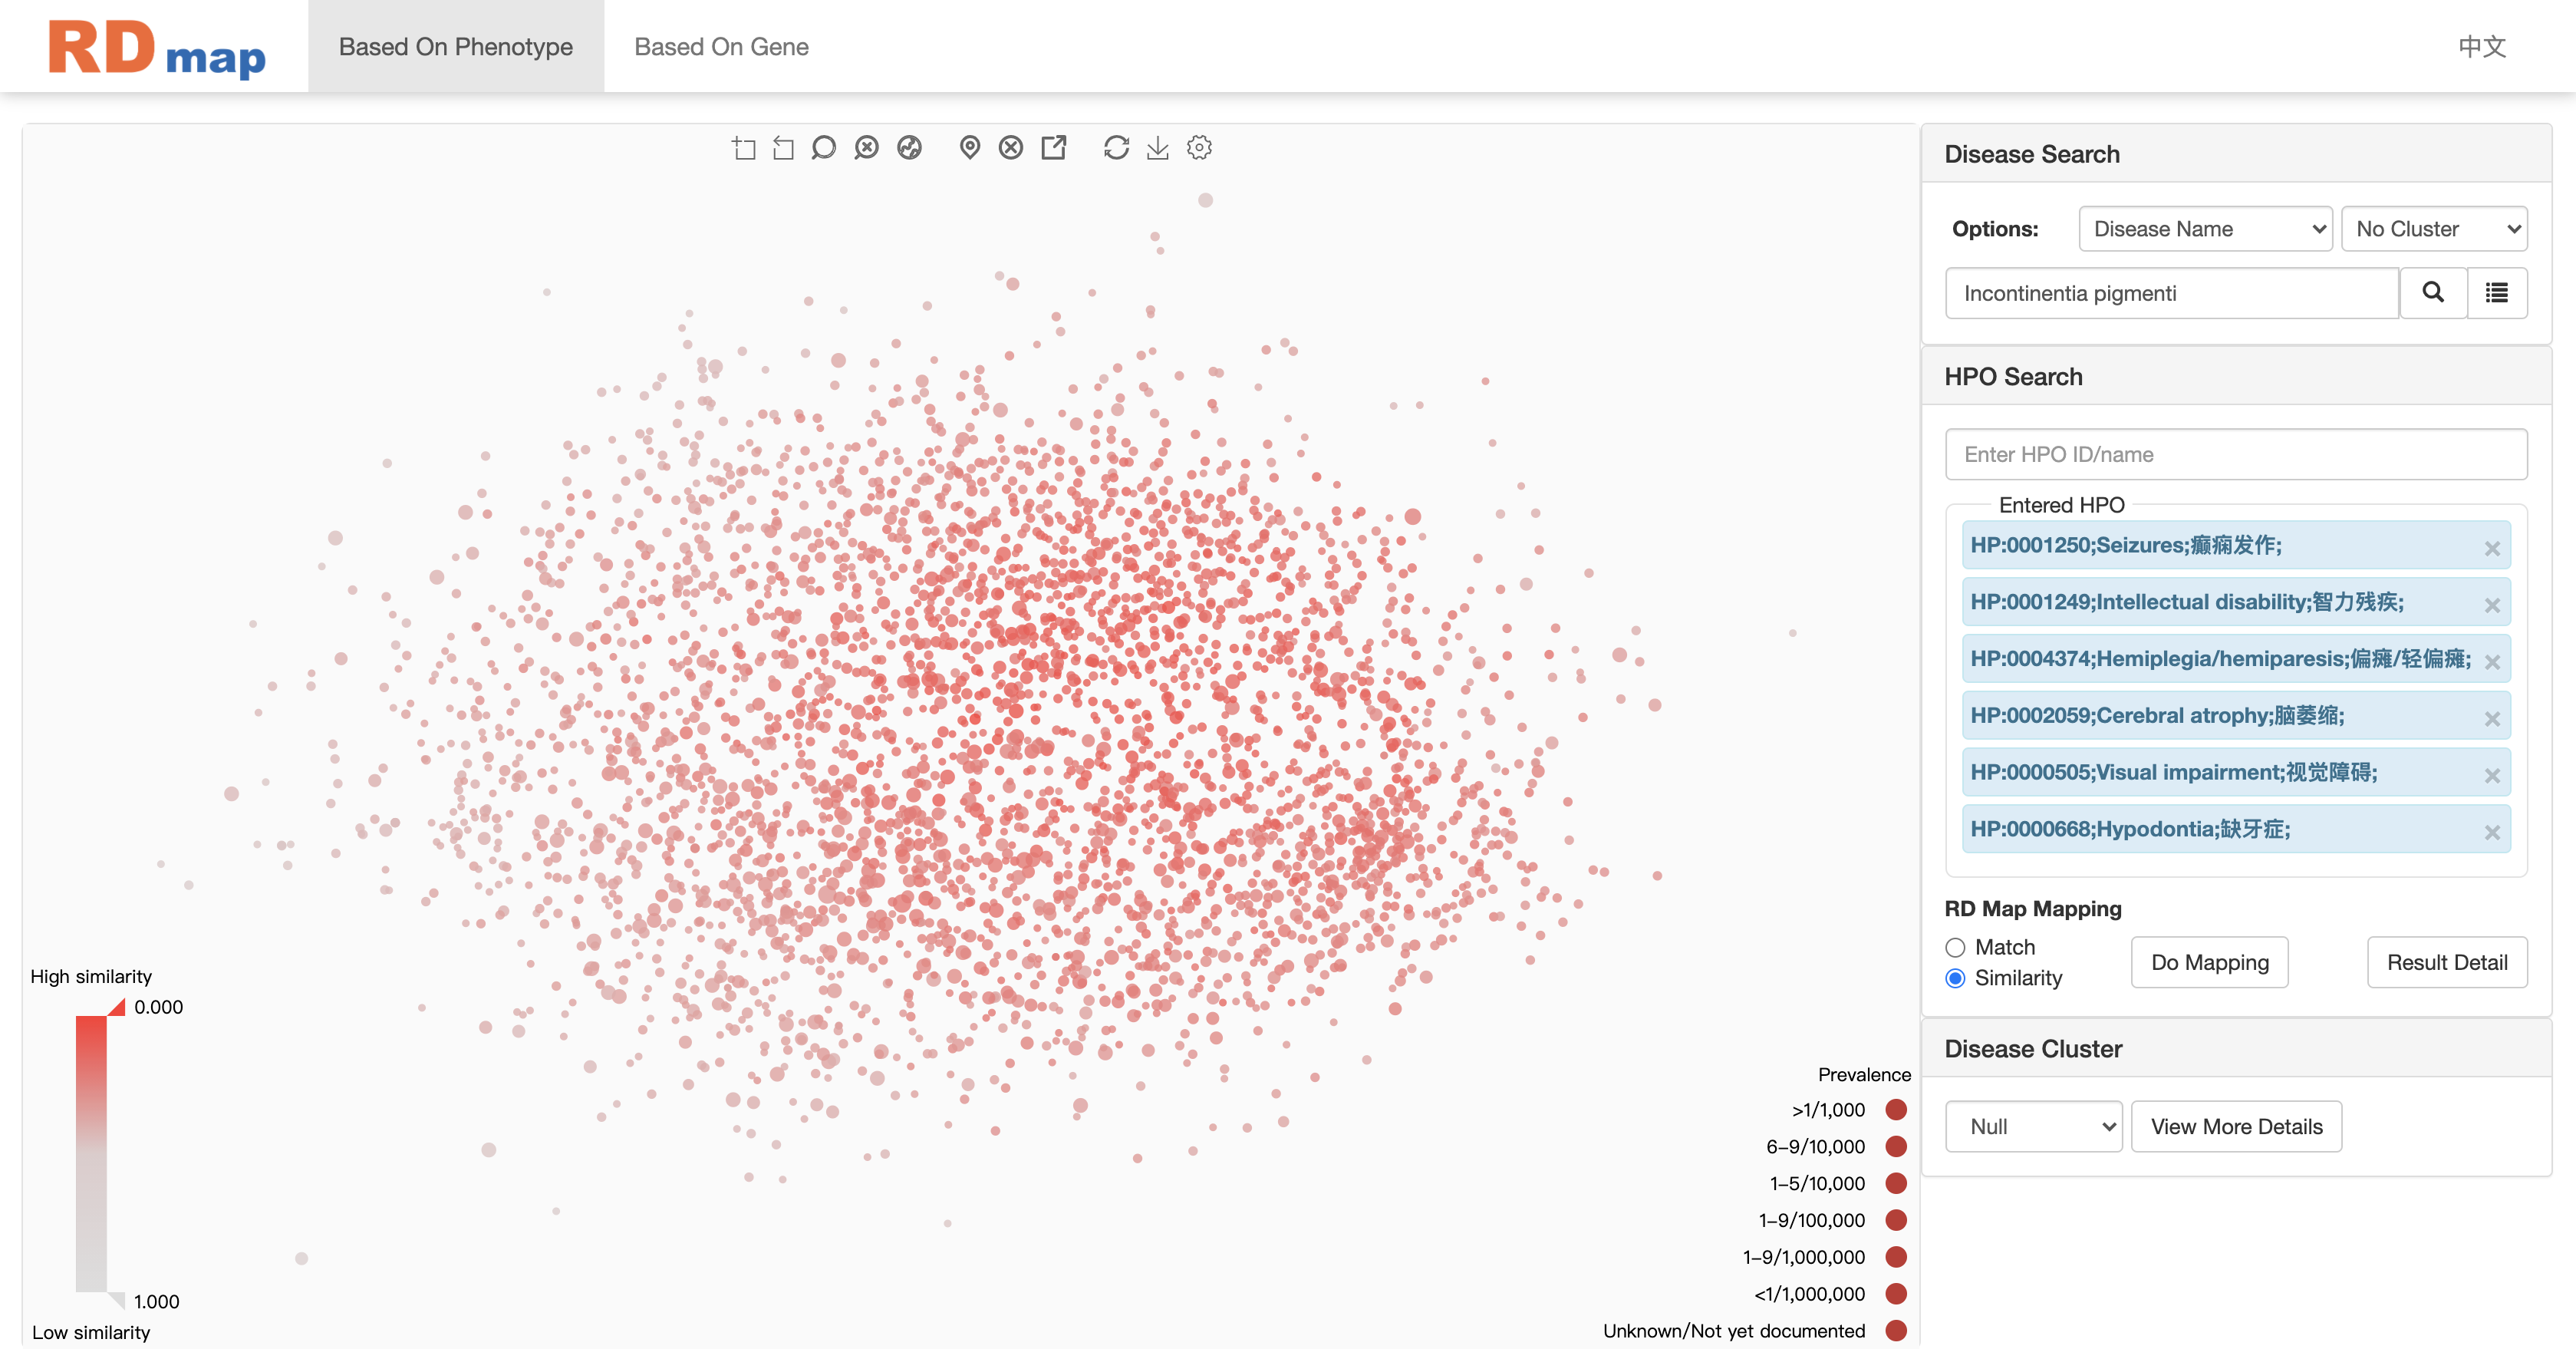
Disease Searchsearch disease in map and view disease details
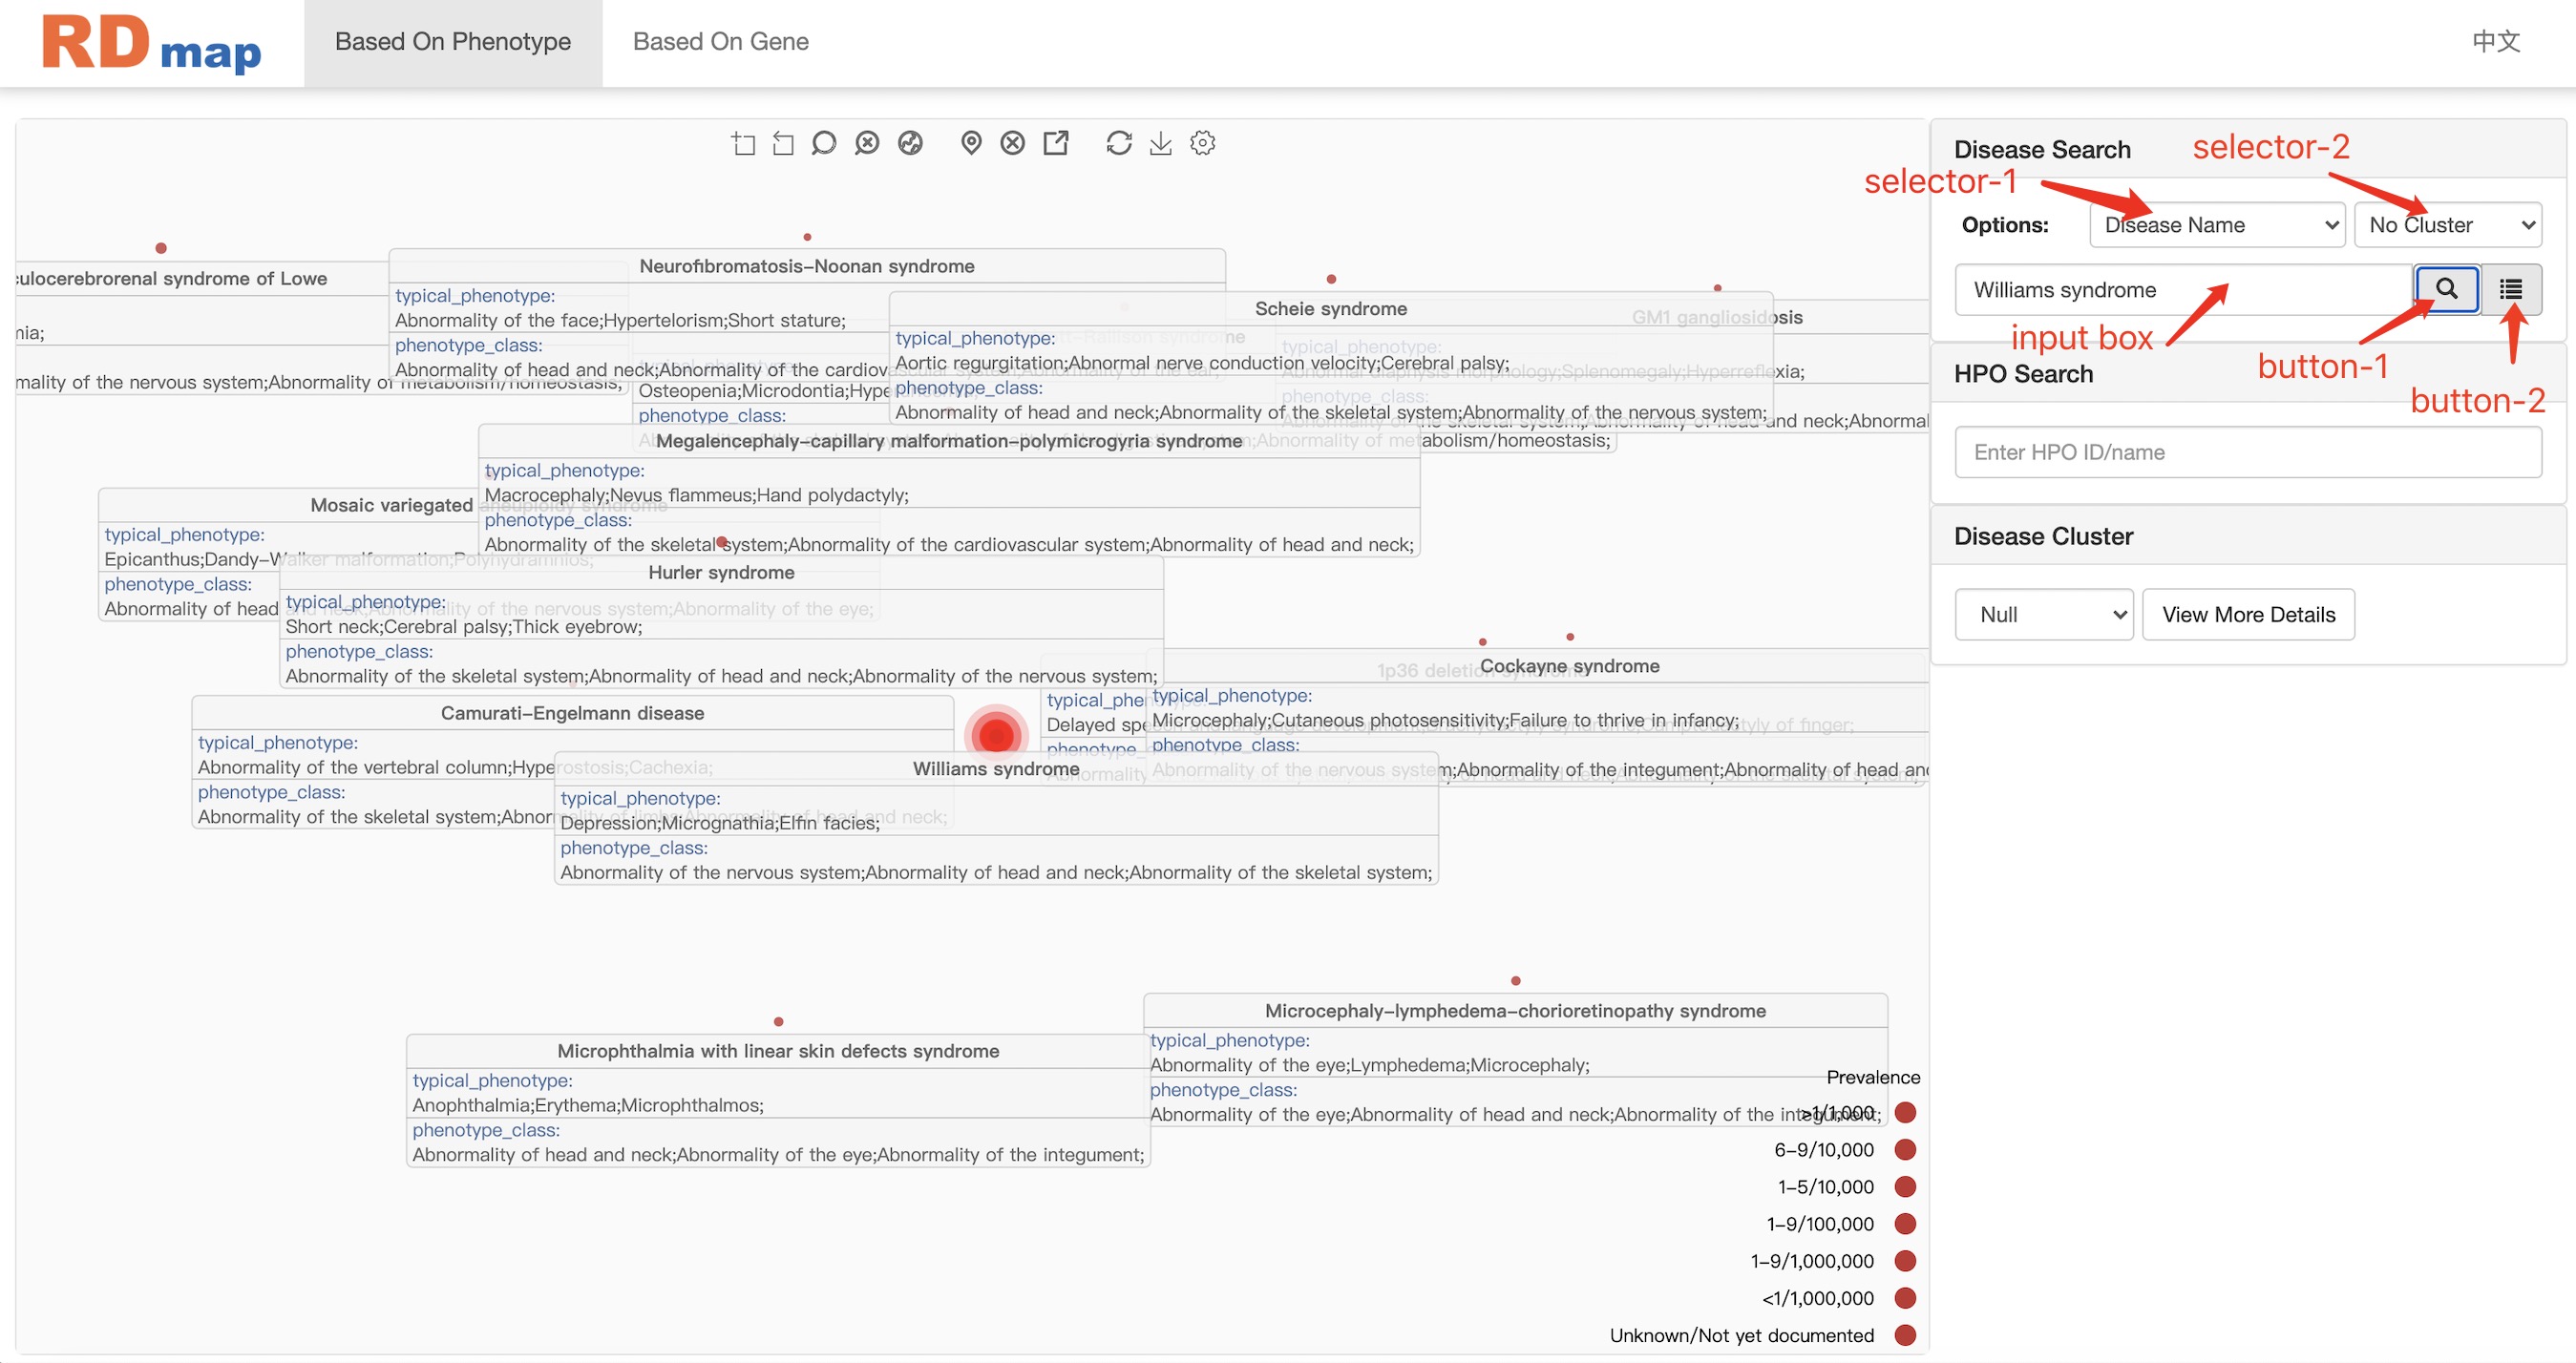
In this navigation workspace, user can locate a disease by directly enter the name of disease in the search box. The auto-completed search box will pop up during the input to help the user identify the right disease term. It also supported using the “disorder ID” or “orpha code” to locate a disease on the RDmap. After user selected the disease and click the search button, the target disease centered RDmap view will be shown like figure above. There is a button next to the search button which will show the detail of the selected disease. User can also setting to automatically show the detail information when a disease was selected by mouse click on RDmap.
selector-1
"Disease Name": standard name of rare diseases counted on orphanet.
"Disorder ID": the unique id of each rare disease in orphanet.
"Orpha Code": commonly used codes for each rare disease in orphanet.
selector-2
"No Cluster": only search and highlight diseases in the input box on RD map.
"In Cluster": search and highlight disease in the input box and diseases of the same cluster on RD map.
"All Cluster": search and highlight disease in the input box and all diseases are colored according to cluster.
input box enter the disease you want to query according to the selector-1.
button-1 search entered rare disease on RD map.
button-2 view detailed information about entered disease in Disease Content module.
When the user uses the input box, a recommendation list will appear below the input box, and the user can directly load the disease name into the input box by clicking an item in the recommendation list.
Phenotype Searchenter a series of phenotypes and map phenotypes to RD map
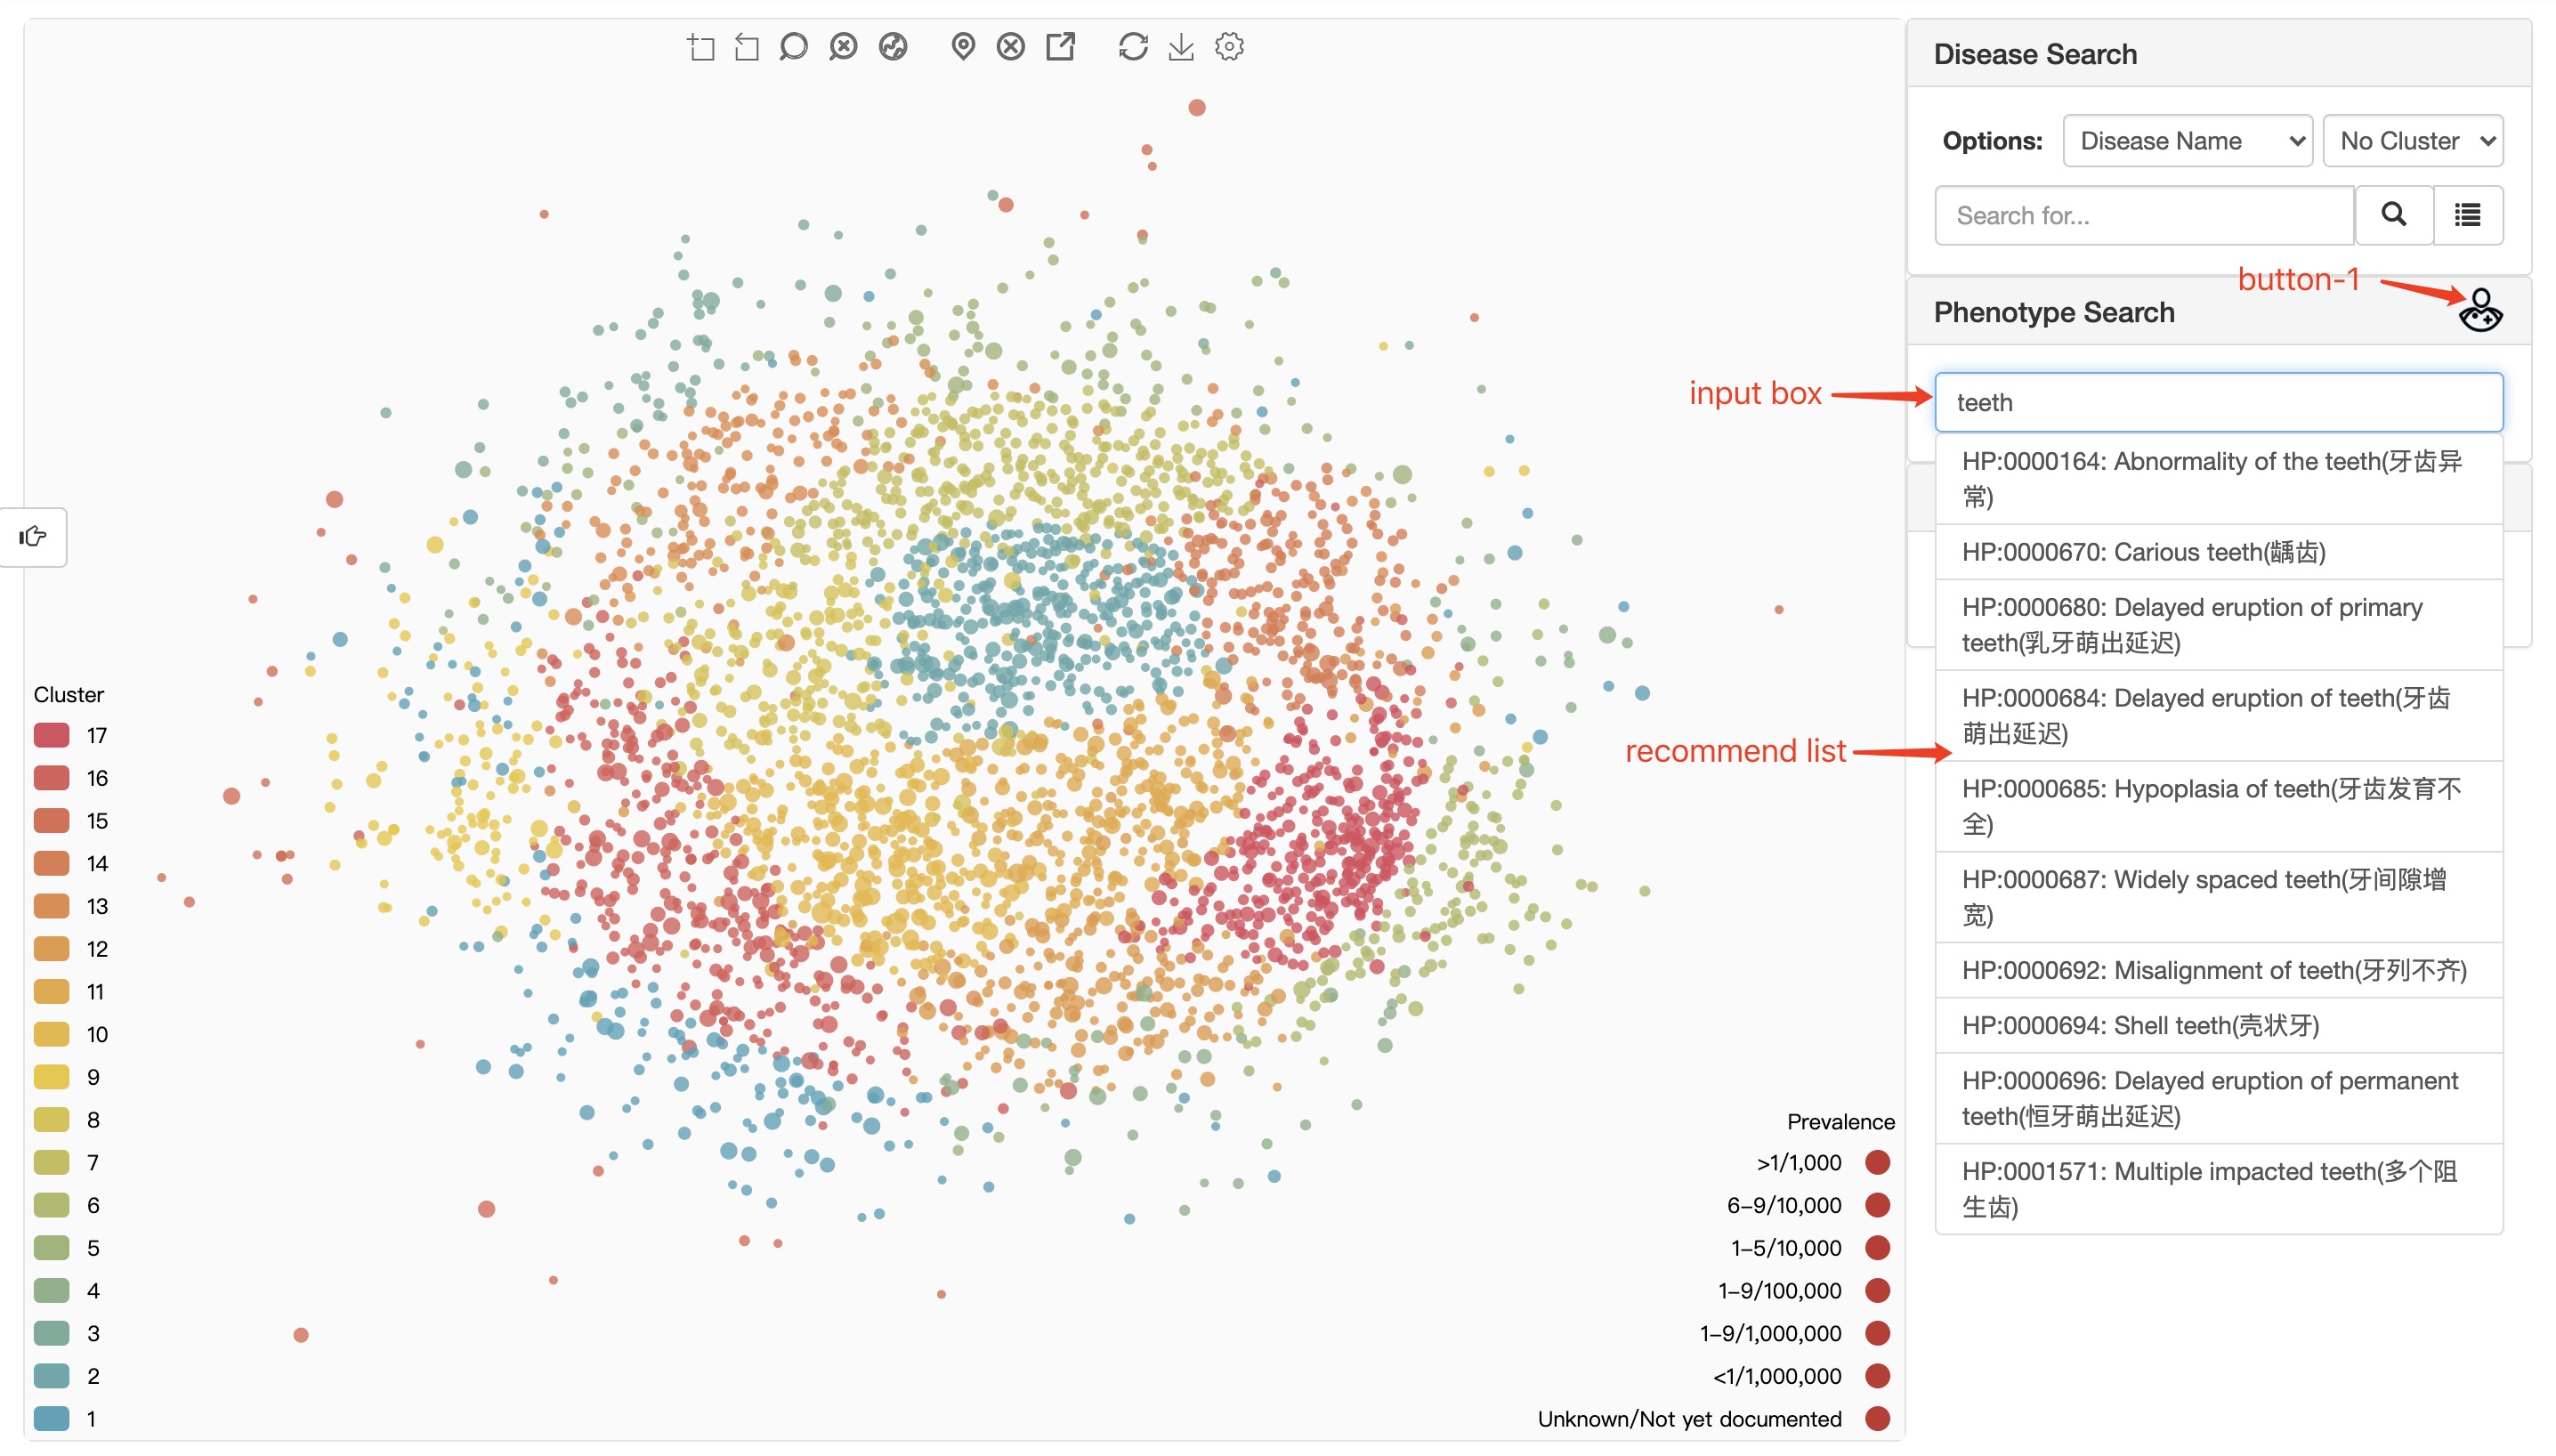
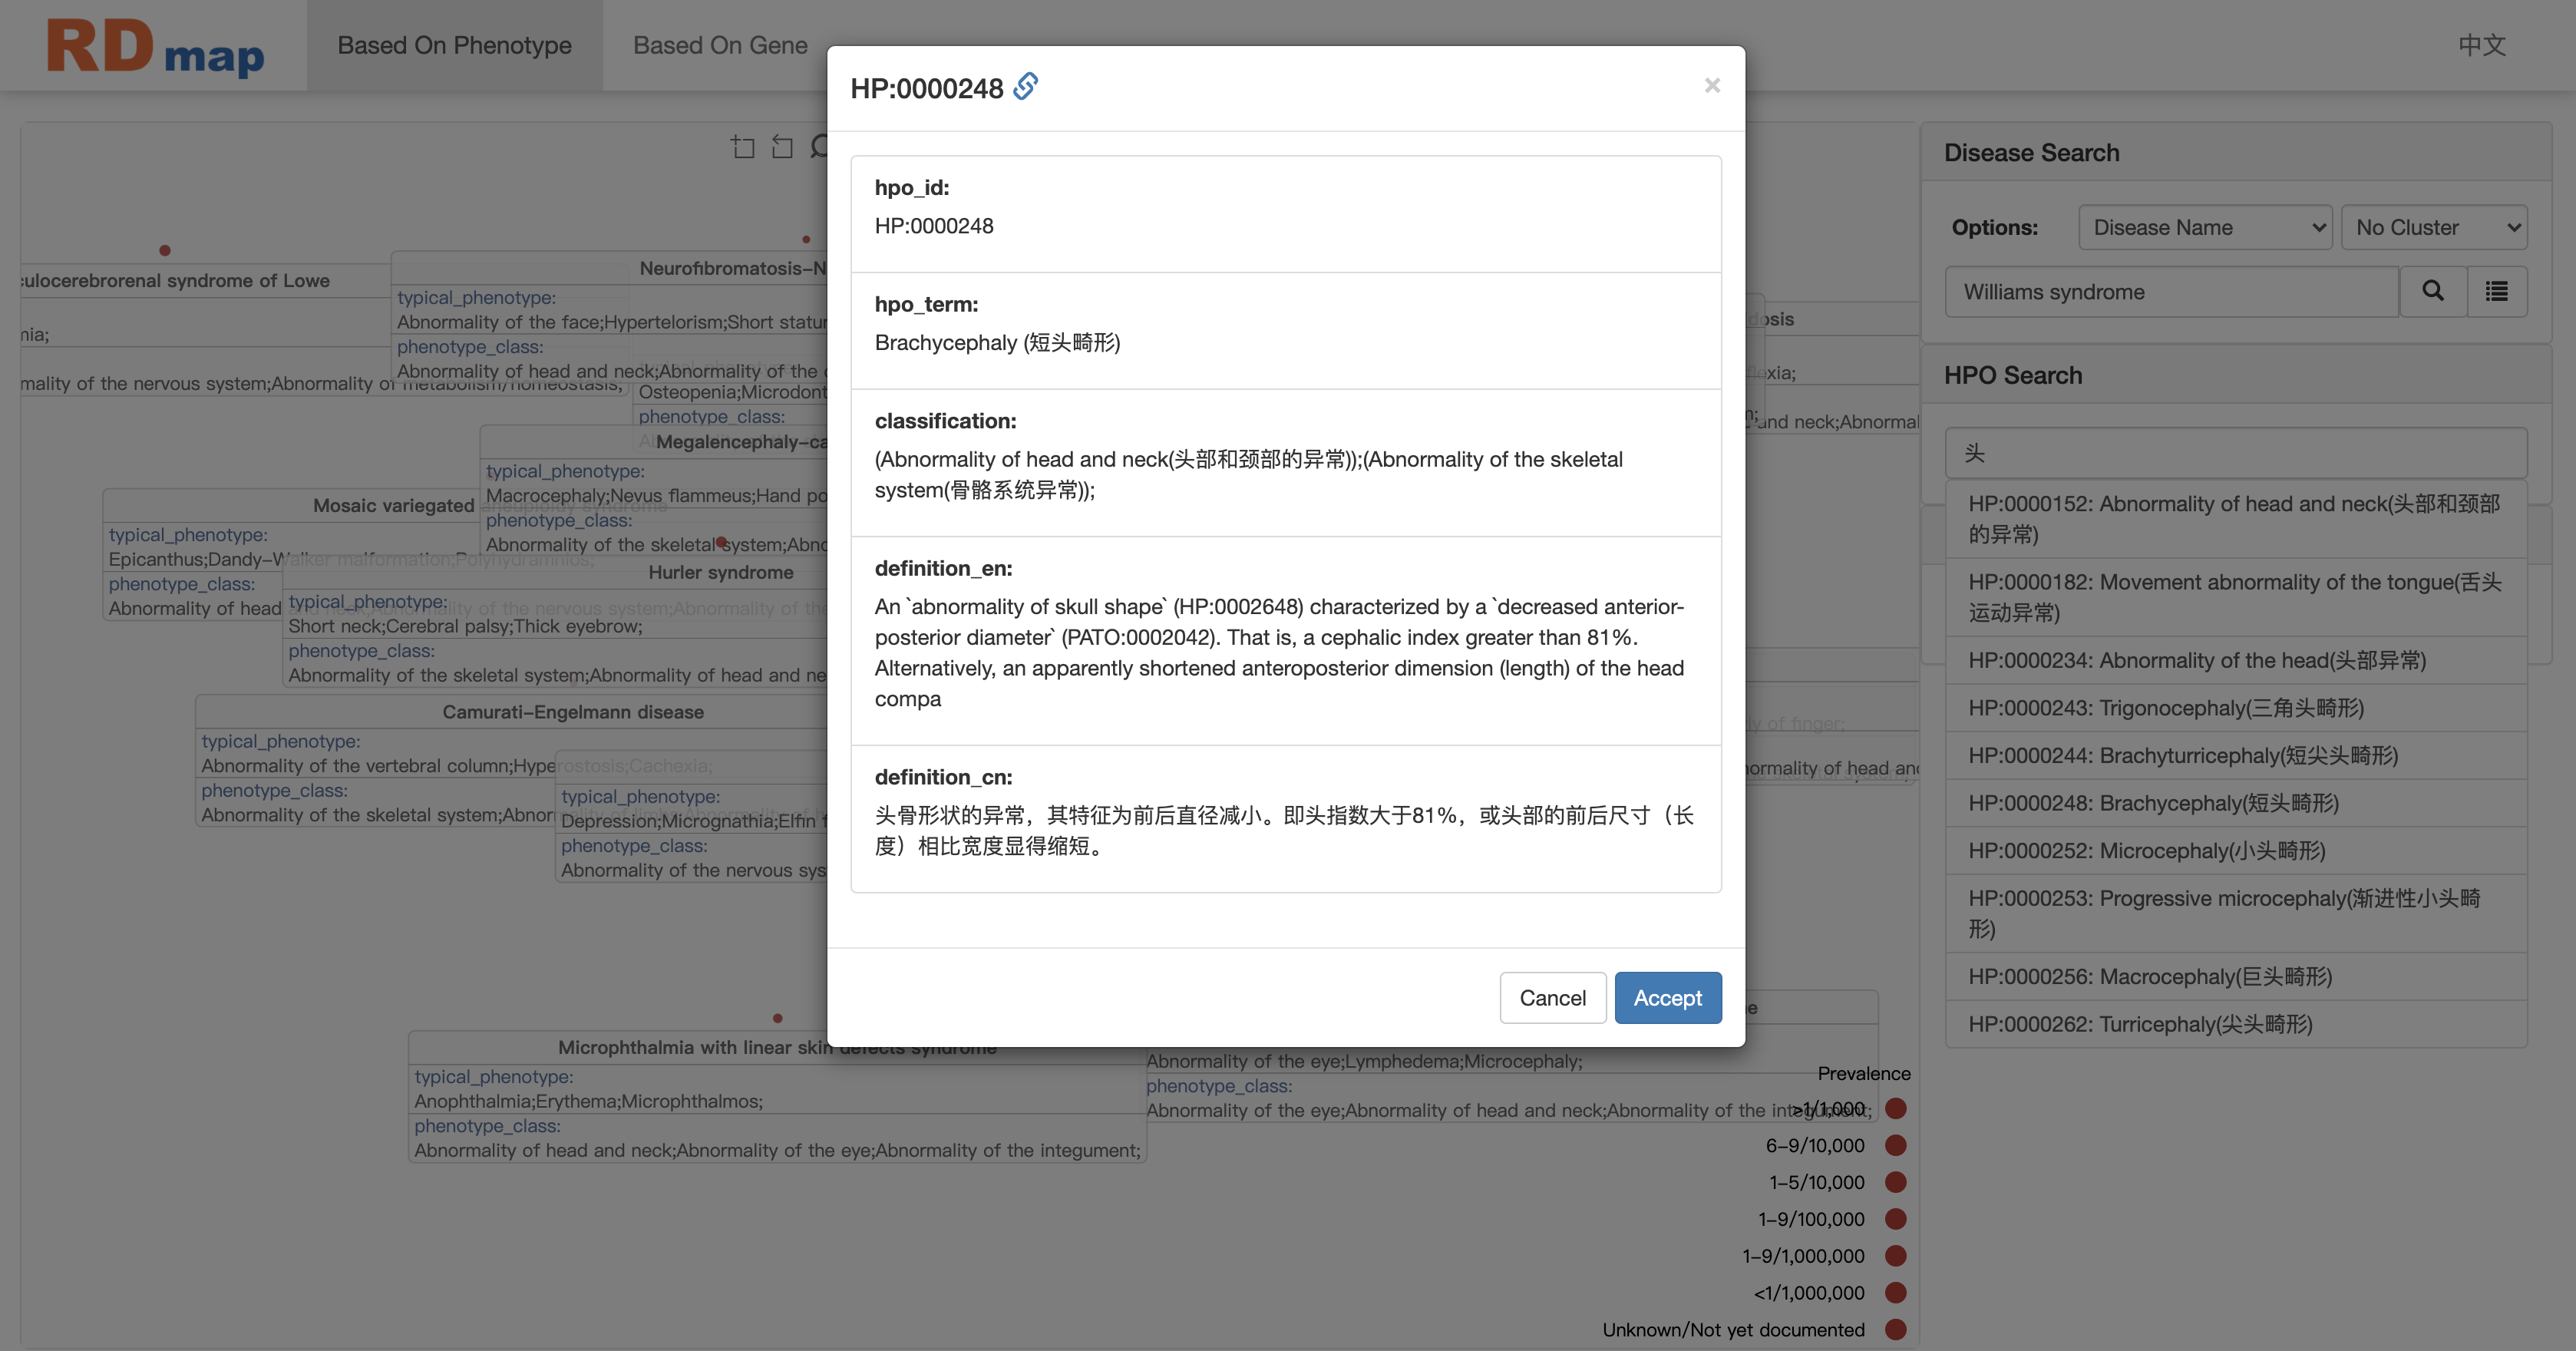
When user using HPO(Human Phenotype Ontology) phenotypes to locate disease, there is also an auto-completed search box available to help user to enter the right HPO terms. When user select an HPO term, there will be a confirm dialogue box to show the definition of the terms as shown in figure below. It will help to control the quality for clinical purpose mapping. There are two type of HPO terms: one is have been used to annotate some rare disease in RDmap ; the other is not. Different type of HPO terms will show with different background color. The first type is blue background, the second is green.
This module is named HPO Search in the old version and Phenotype Search in the new version.
input box user can enter HPO ID or phenotype name here.
recommend list the system makes recommendations based on user input. Clicking on an item in the recommendation list can trigger phenotype confirm dialogue.
button-1 trigger a dialog box to collect phenotypes from human body.
Our system only supports the input of phenotypes counted in HPO (sub-concept of "HP:0000118;Phenotypic abnormality" in HPO system).
The phenotype confirm dialogue can only be triggered by clicking on an item in the recommend list.
Click the Accept button to select a phenotype.
For detailed instructions on phenotype mapping, please see the RD Map Mapping module.
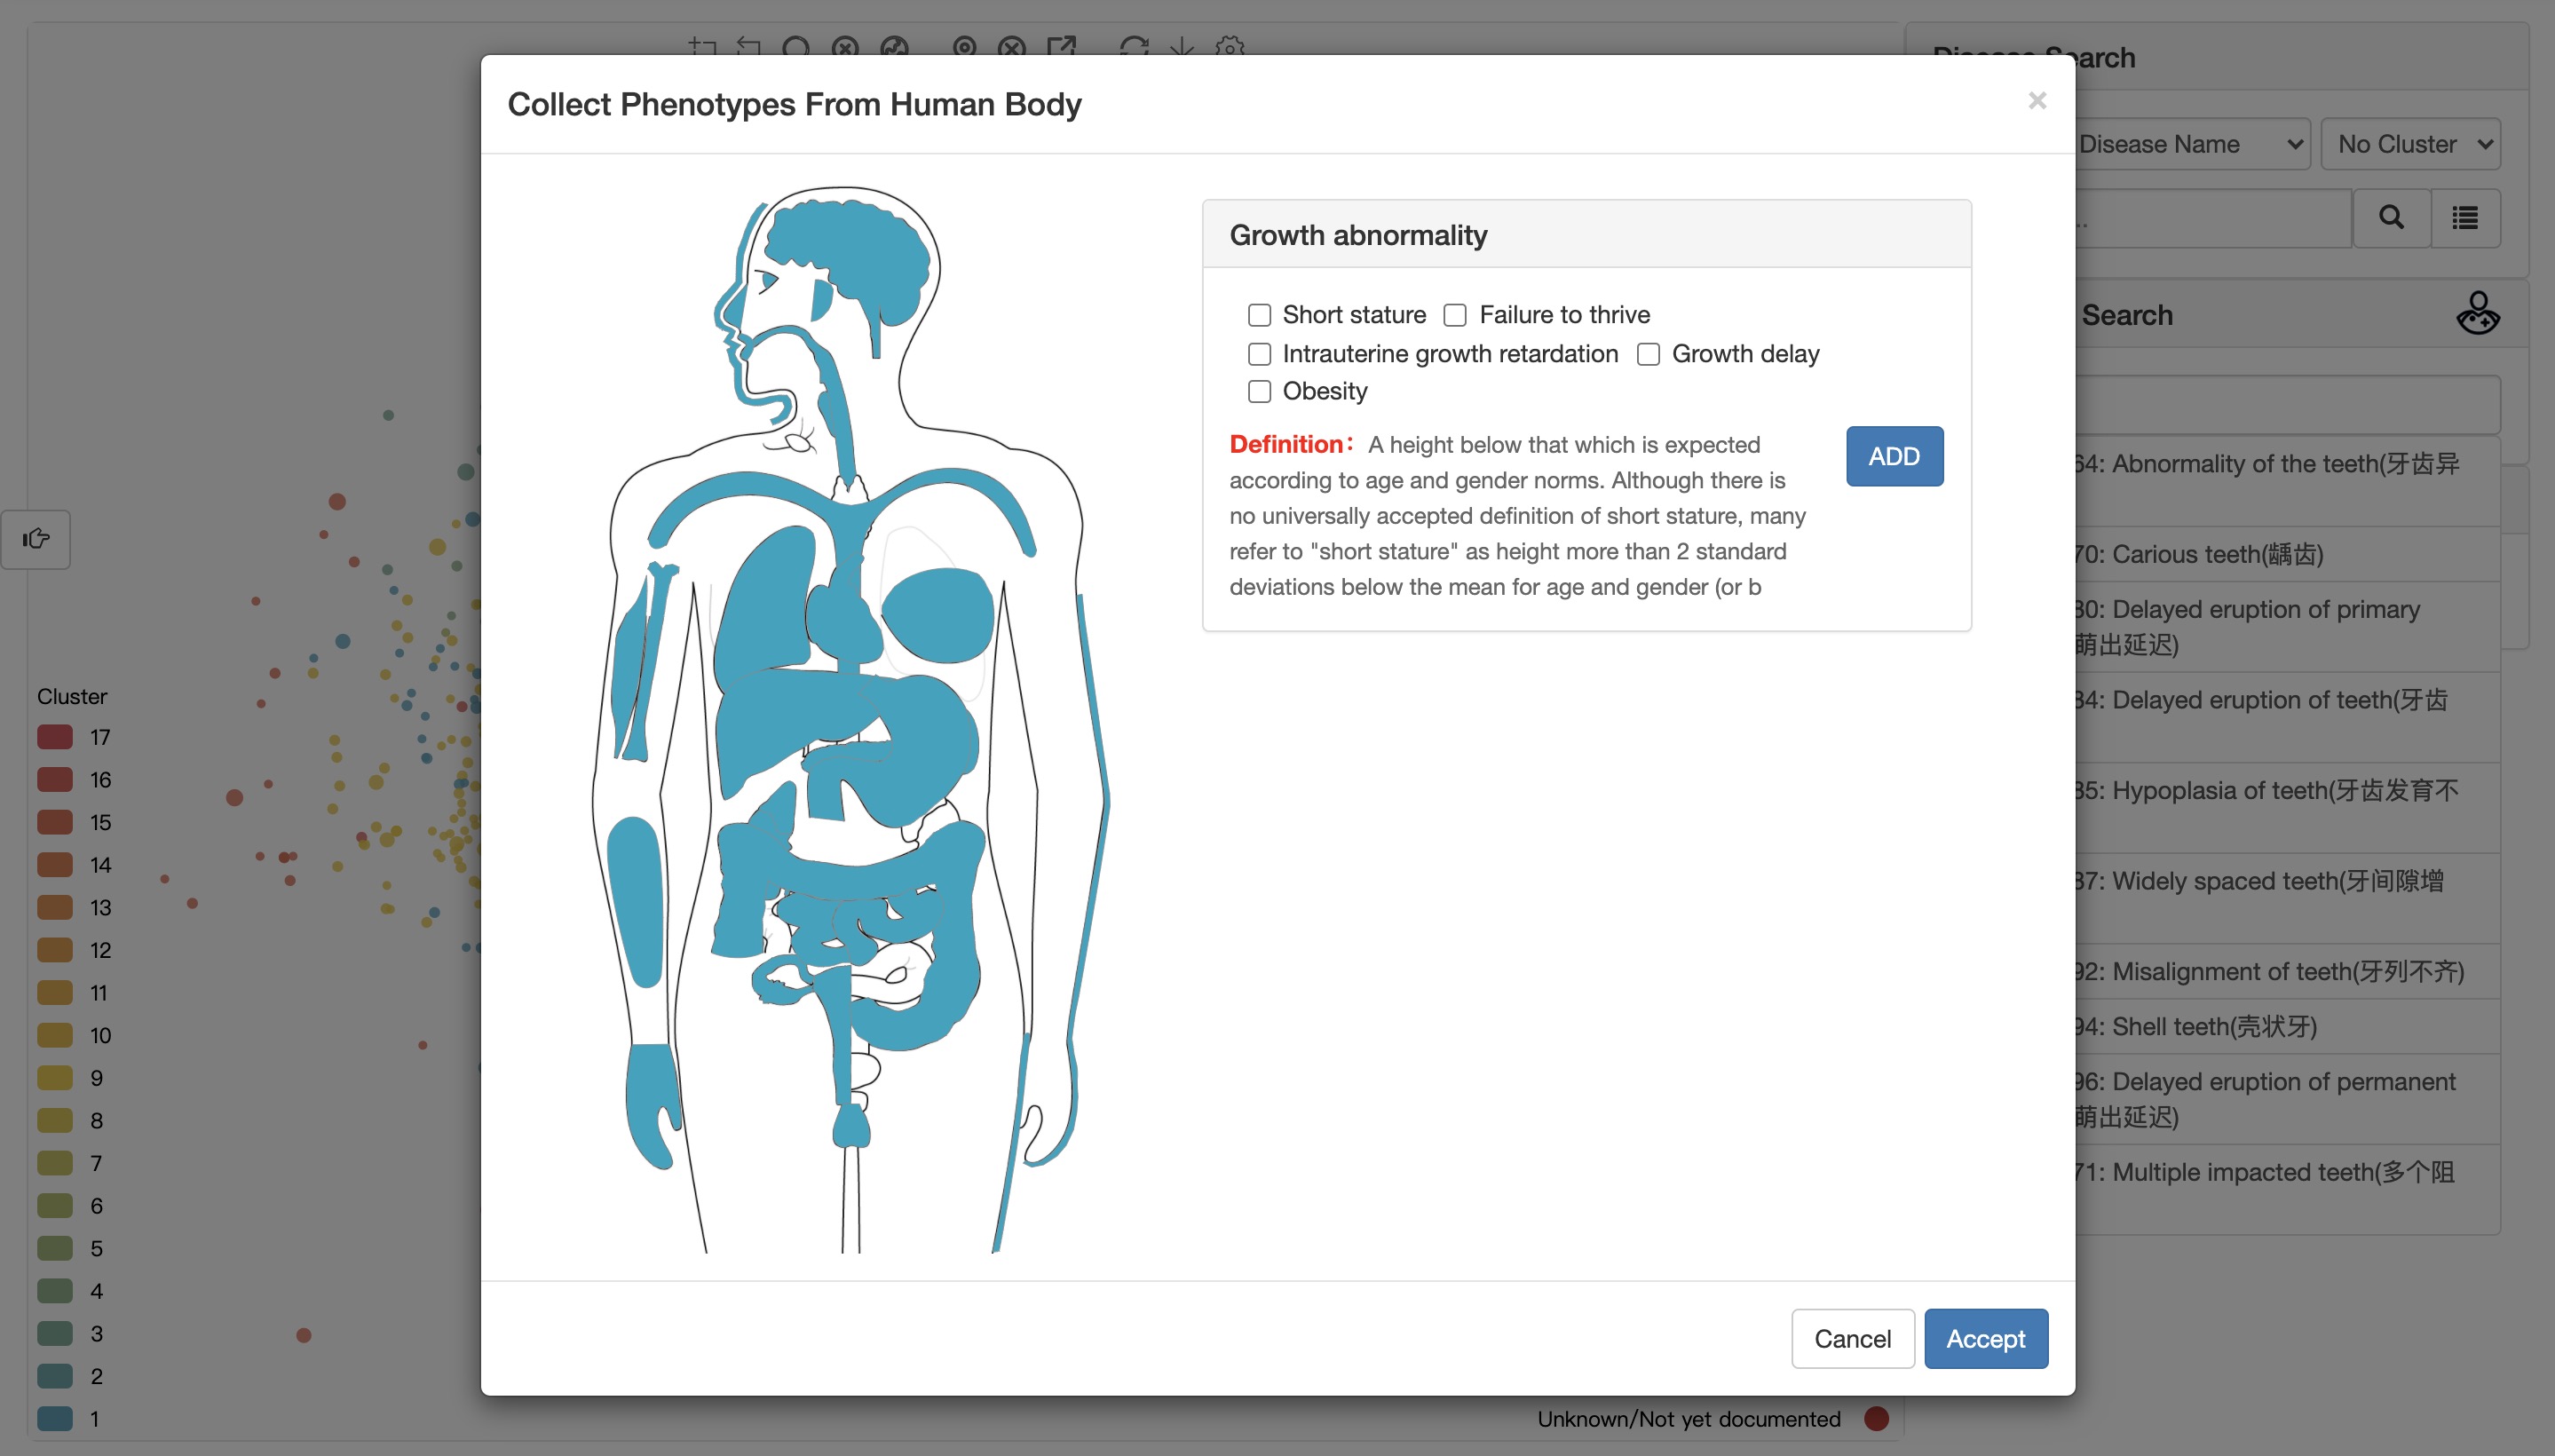
Click the ADD button to enter the selected phenotypes.
Click the Accept button to receive the entered phenotypes.
Users can first click on different parts of the human body figure on the right, and then select the corresponding common phenotypes.
Gene Searchenter a series of genes and map genes to RD map
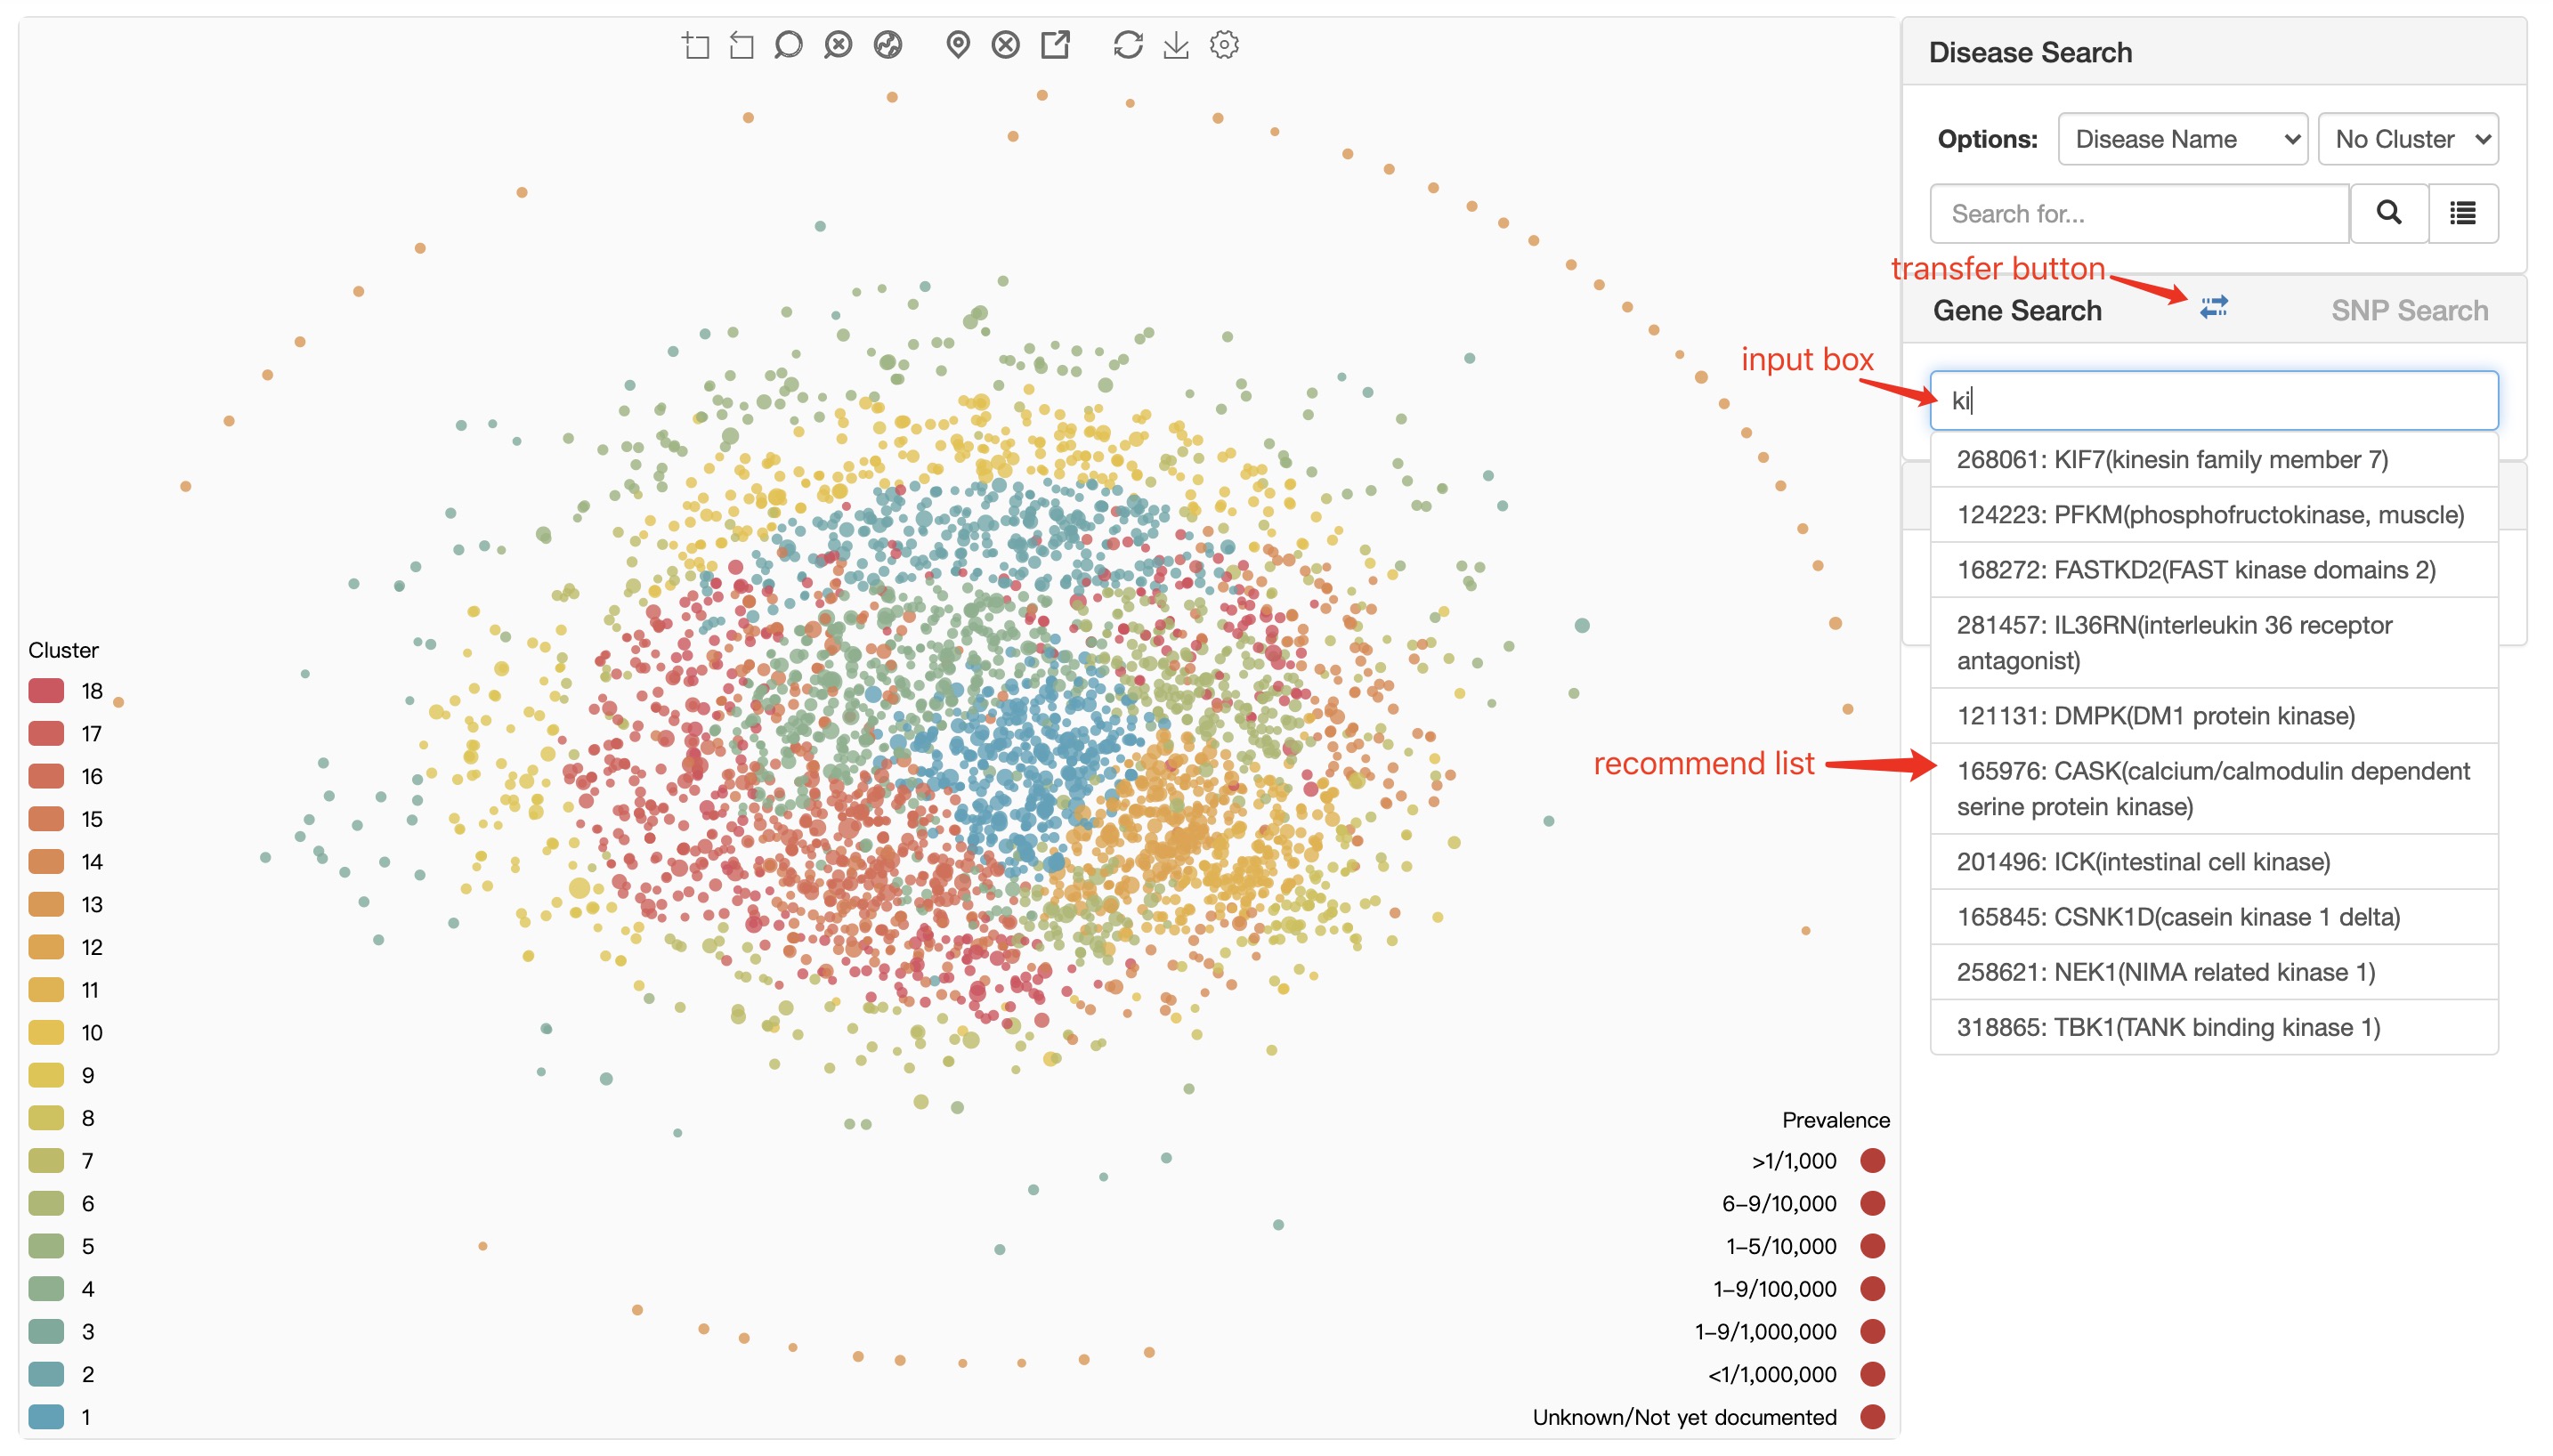
When user using gene symbol to locate disease, there is also an auto-completed search box available to help user to enter the right gene symbol. When user select a gene symbol, there will be a confirm dialogue box to show some information as shown in figure below.
input box user can enter gene symbol or gene name here.
recommend list the system makes recommendations based on user input. Clicking on an item in the recommendation list can trigger gene confirm dialogue.
transfer button transfer from Gene Search module to SNP Search module.
Our system only supports the input of genes related to rare diseases.
The gene confirm dialogue can only be triggered by clicking on an item in the recommend list.
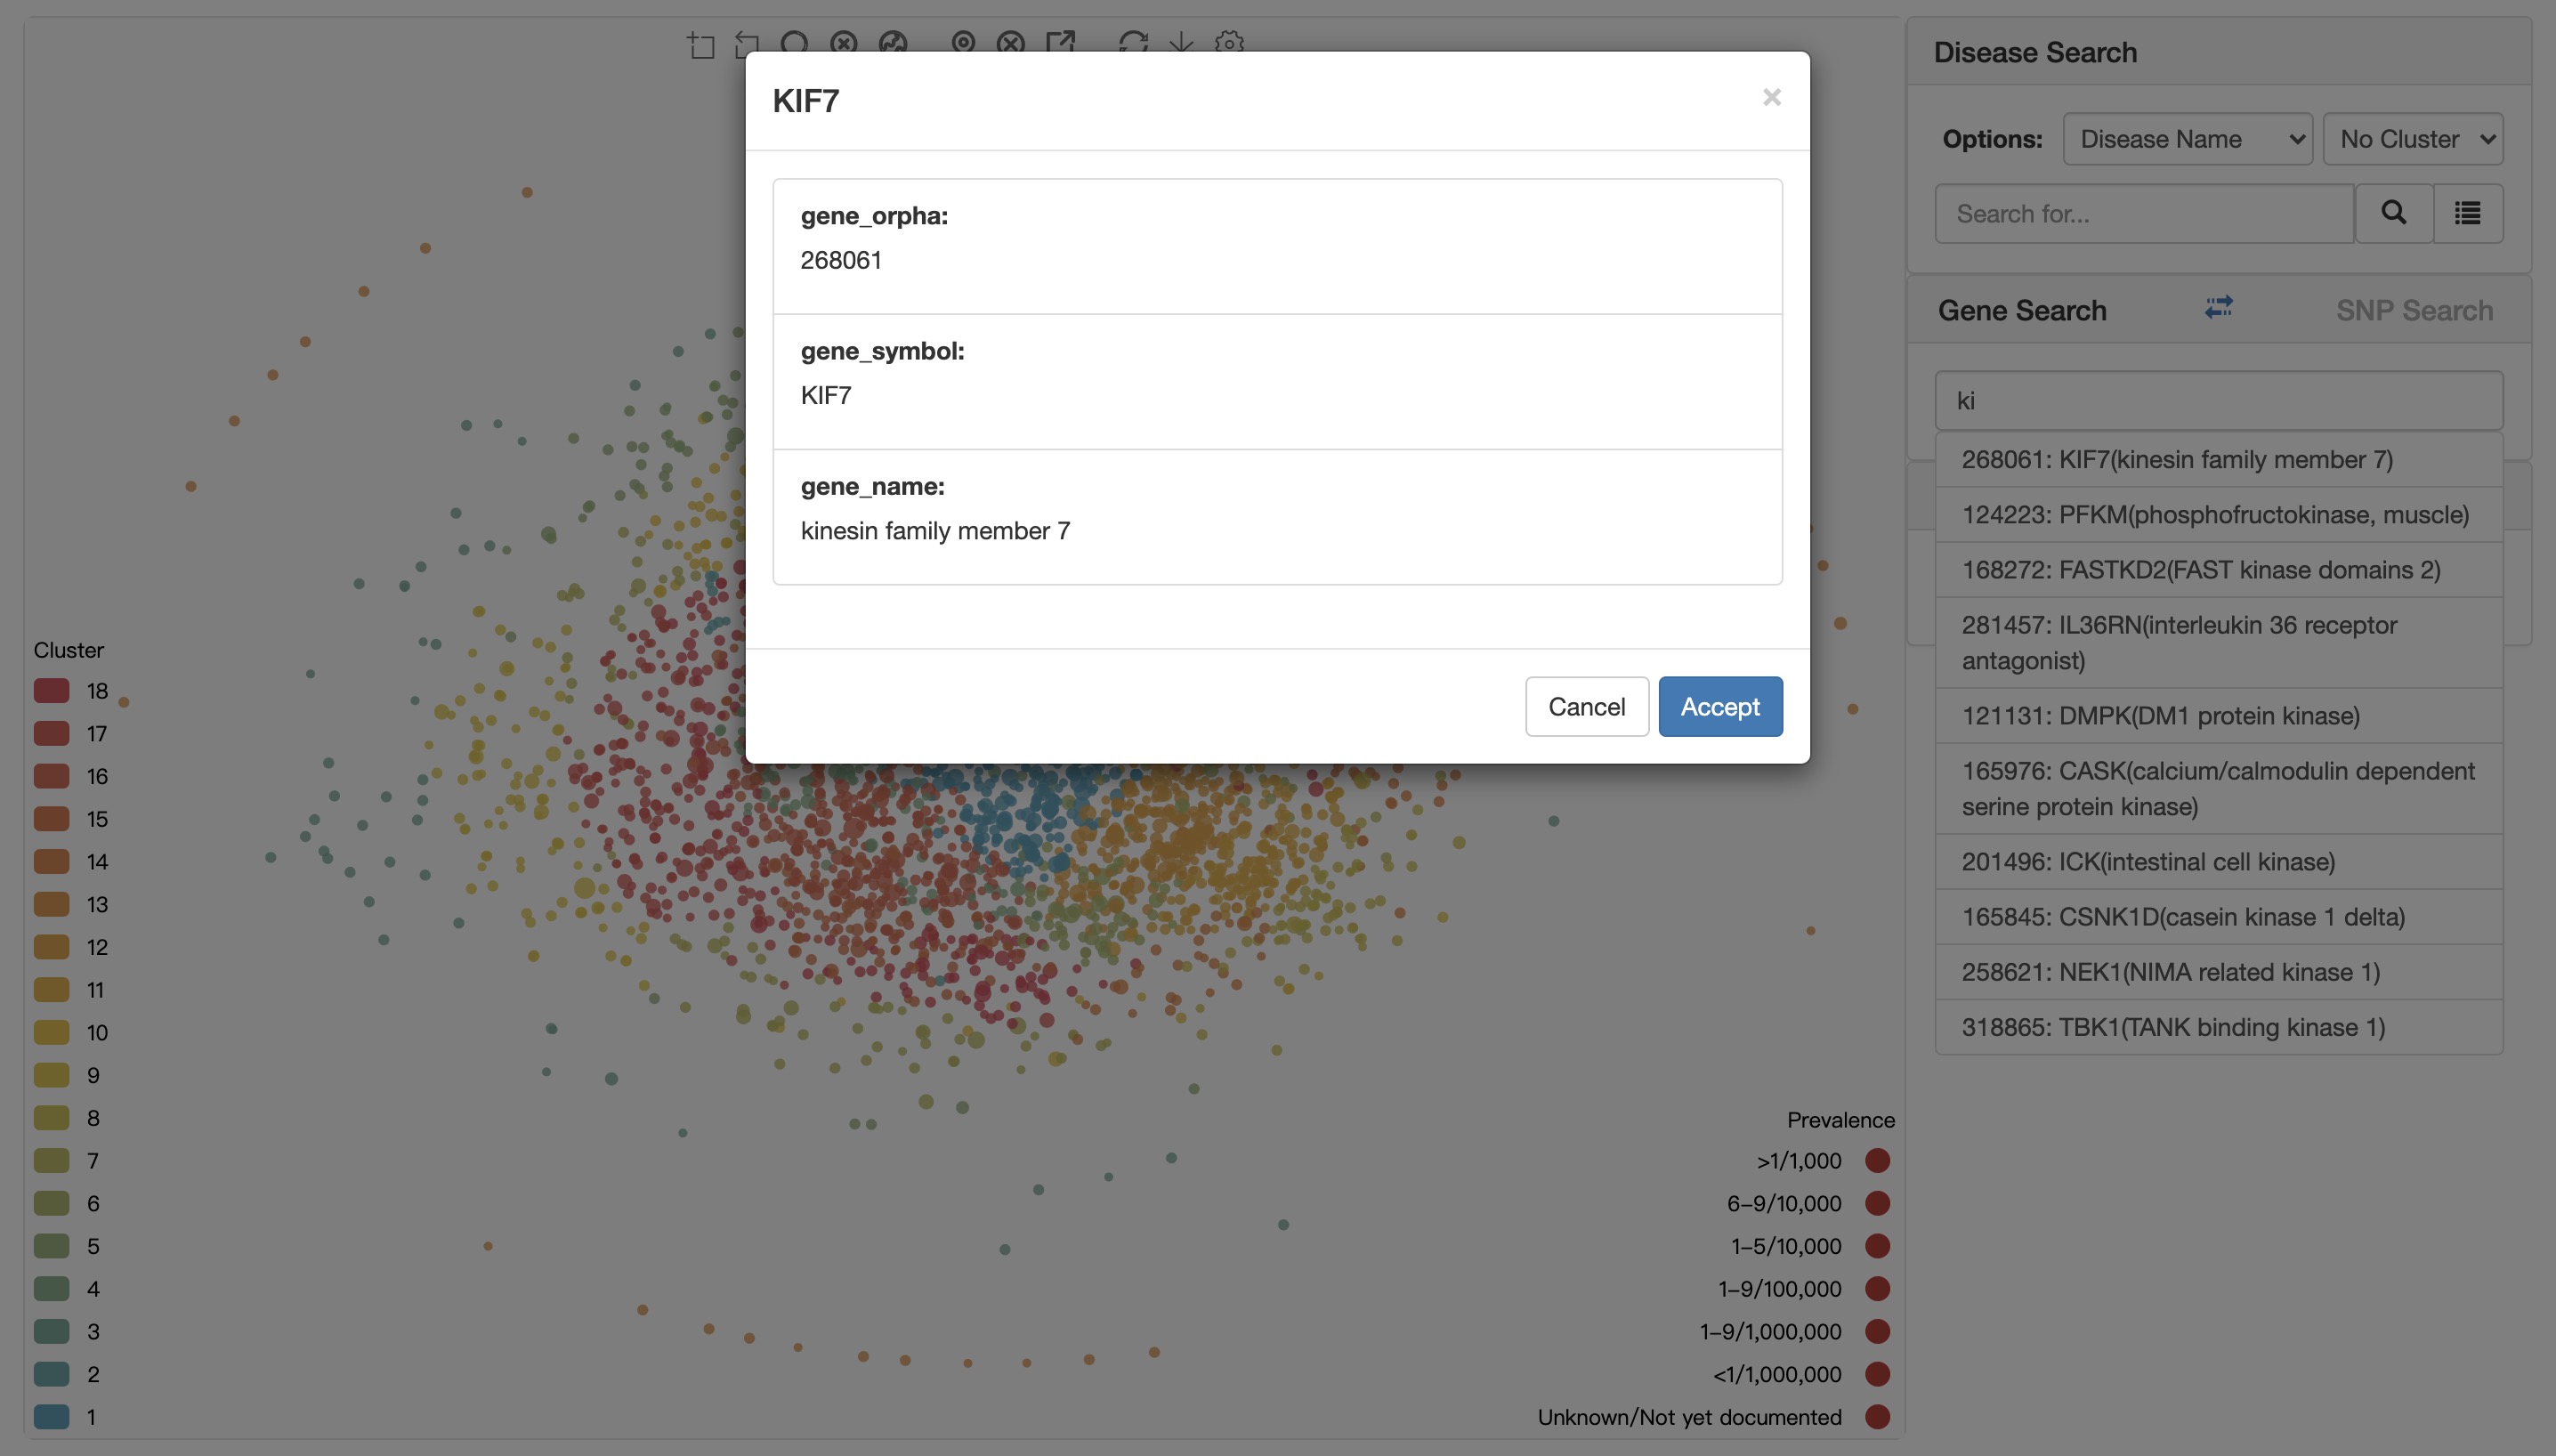
Click the Accept button to select a gene.
For detailed instructions on gene mapping, please see the RD Map Mapping module.
SNP Searchenter a series of SNP and map SNPs to RD map
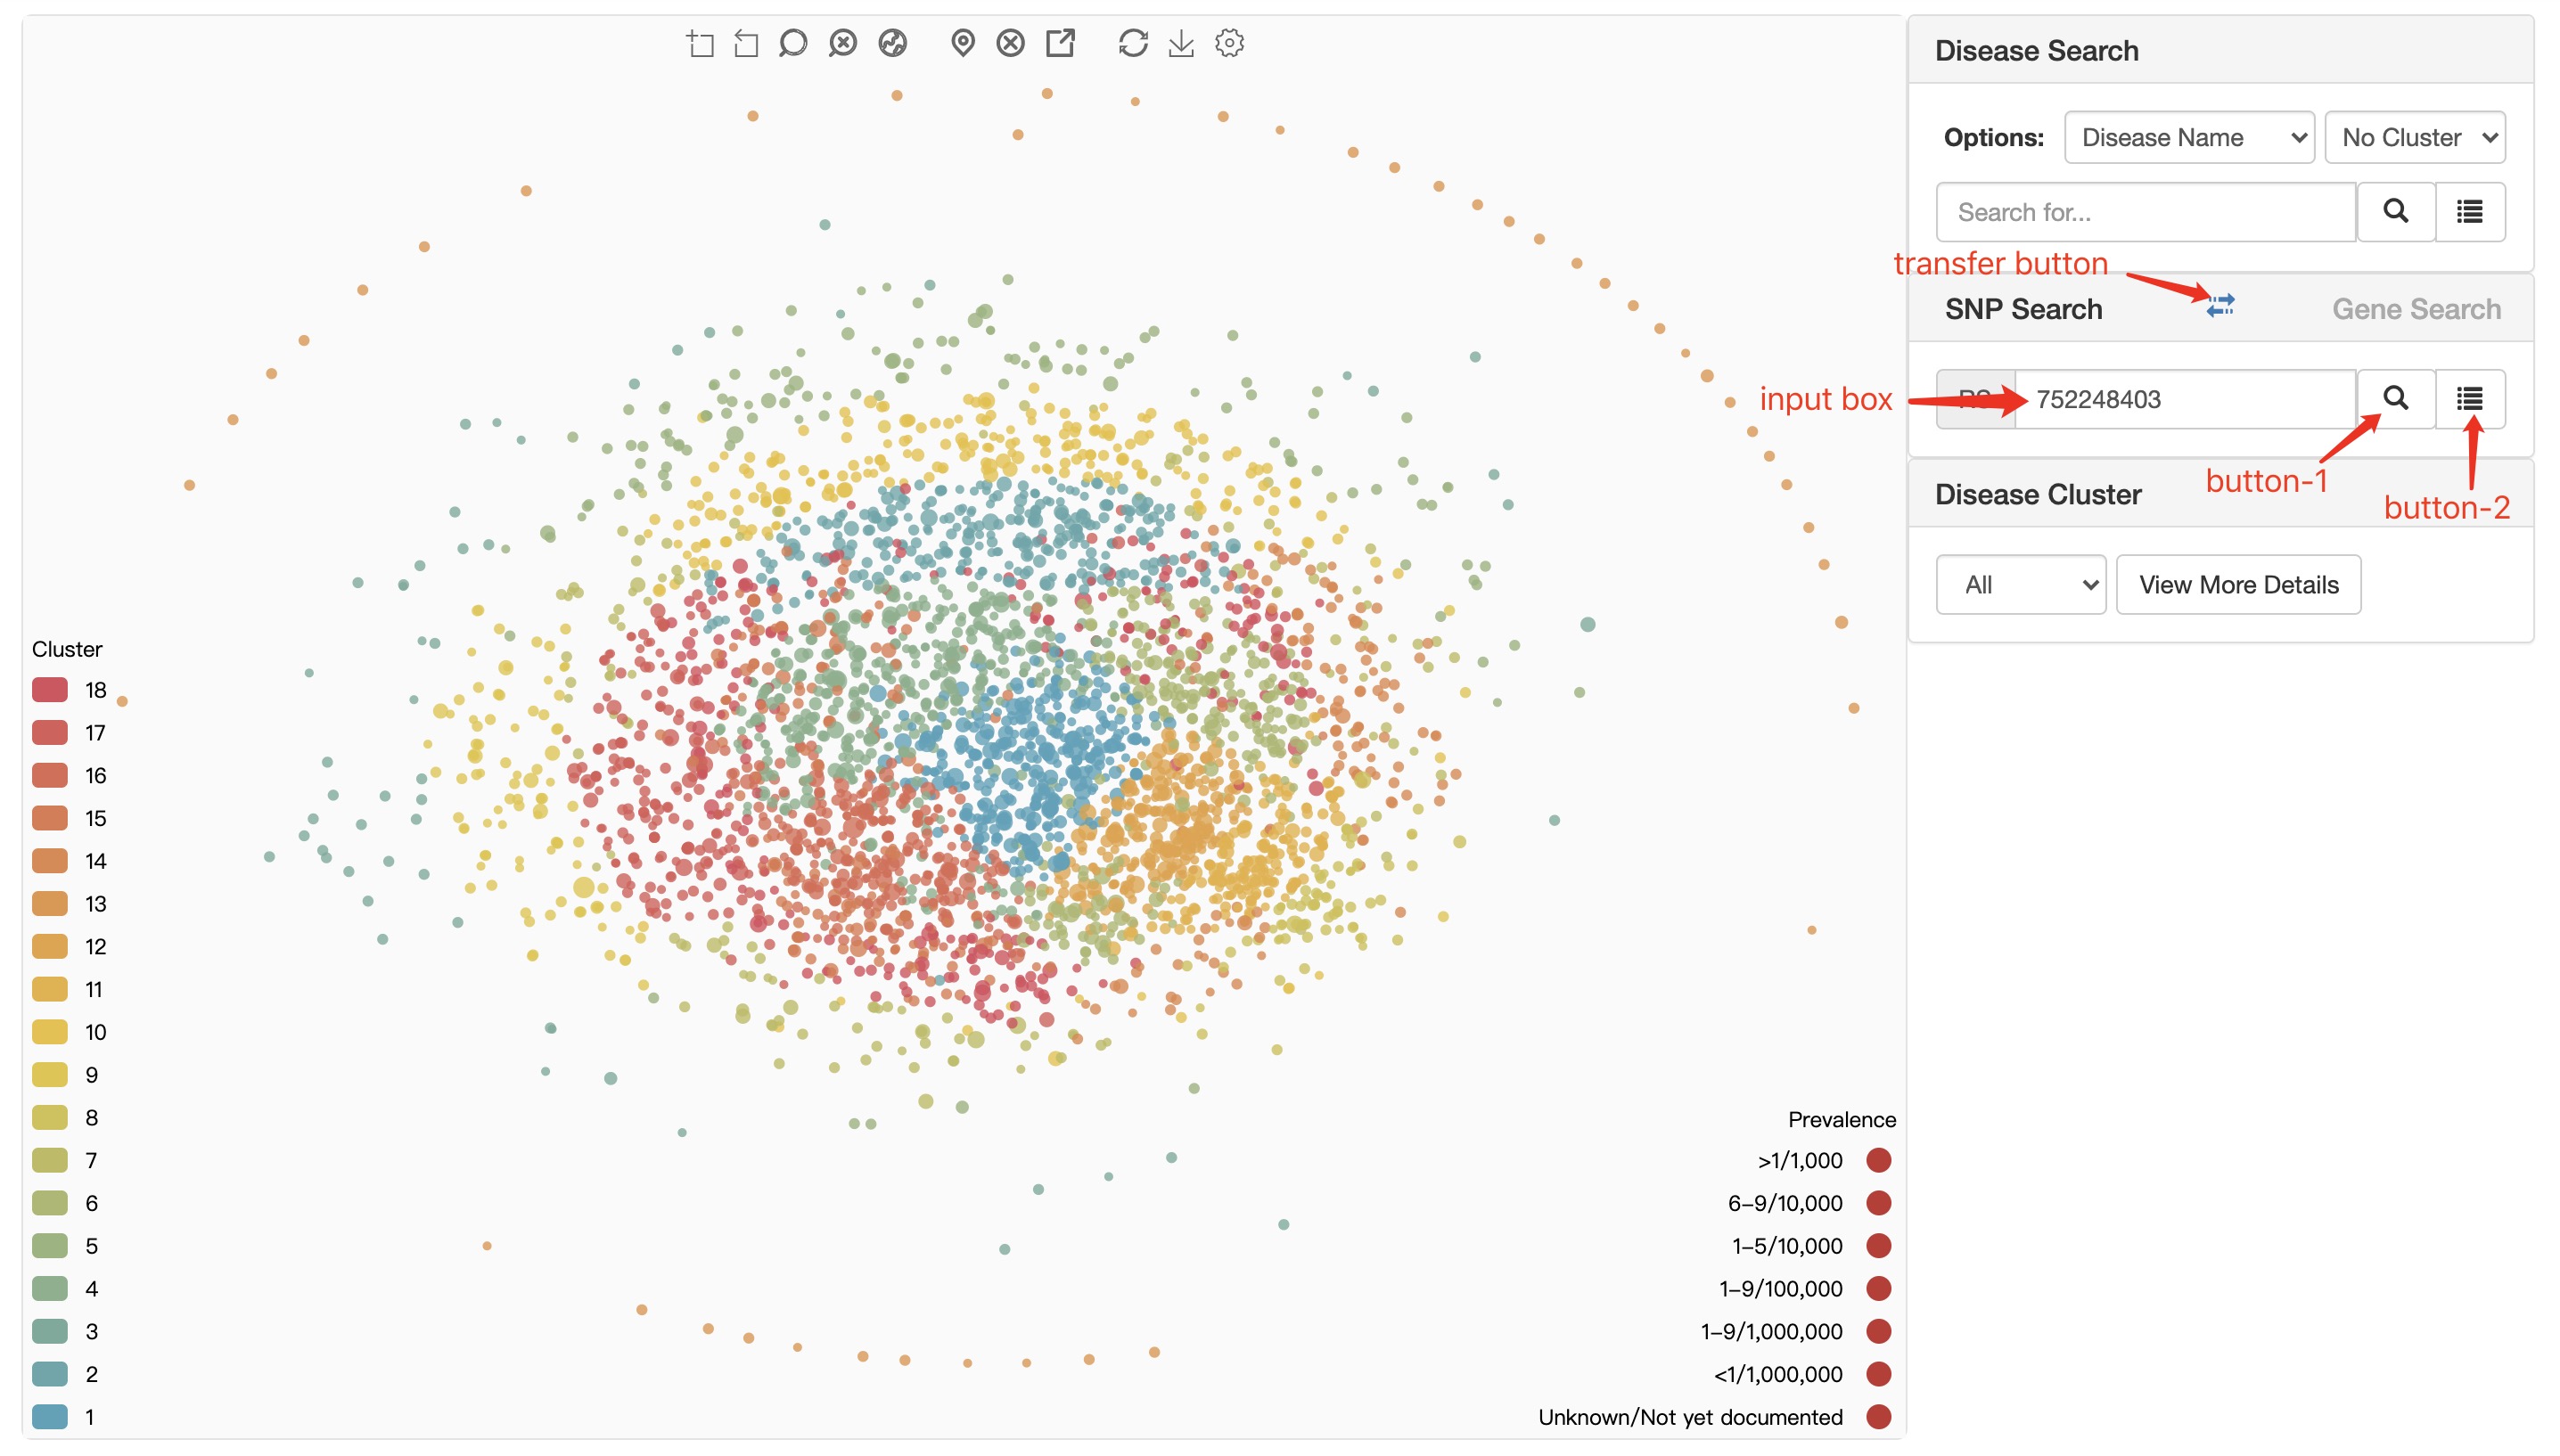
SNP search module does't have an auto-completed search box. The user needs to complete the input by himself. When user search a SNP, there will be a confirm dialogue box to show some information as shown in figure below.
input box user can enter SNP ID here.
button-1 search for the entered SNP and trigger The SNP confirm dialogue.
button-2 trigger searched SNP confirm dialogue.
transfer button transfer from SNP Search module to Gene Search module.
Our system only supports the input of SNPs related to rare disease genes.
The SNP confirm dialogue can be triggered by clicking on button-1 or button-2.
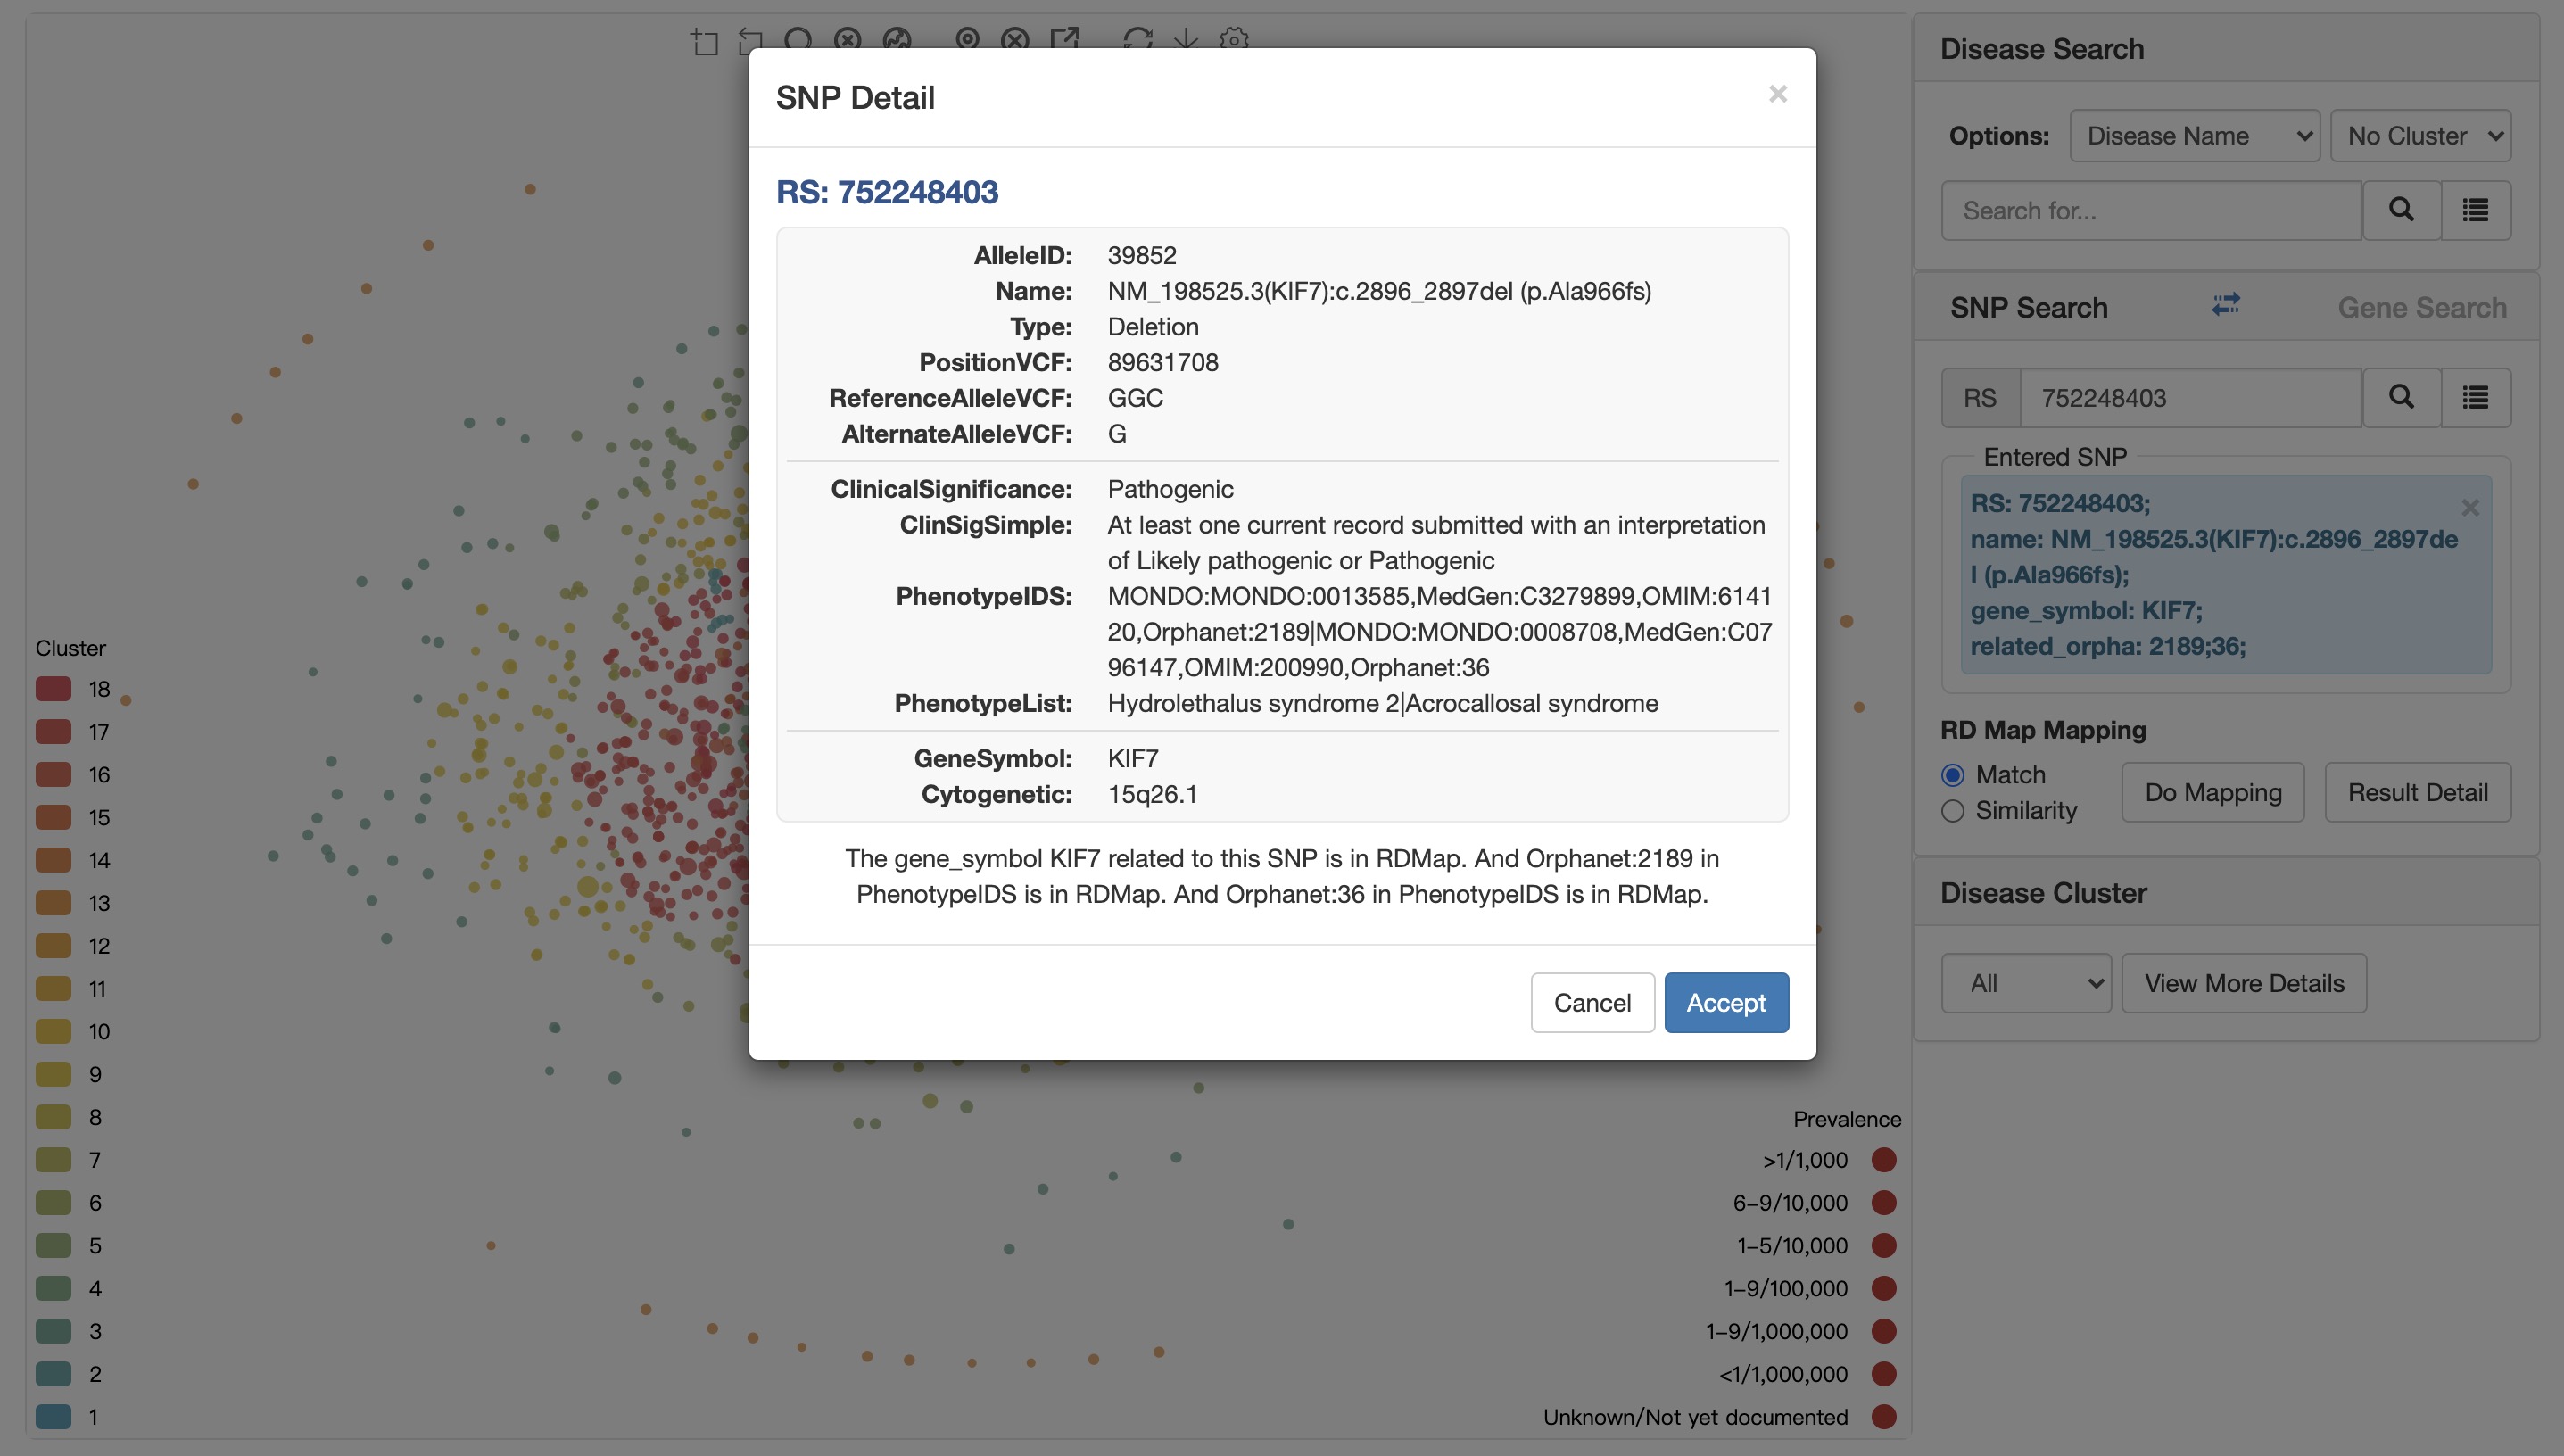
Click the Accept button to select a SNP.
The dialog box shows the detailed information of the SNP (obtained from the clinvar database) and simply analyzes the relationship between the SNP and rare diseases.
For detailed instructions on SNP mapping, please see the RD Map Mapping module.
RD Map Mappingmap similarity features to RD map
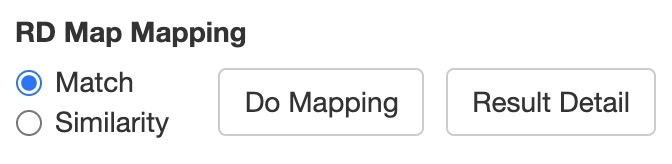
After the phenotypes/gene/SNP were selected, here are two mapping mode can be selected using the radio box:
Match is using the exact match approach.
Similarity is using the similarity distance between the description with all diseases.
Only the annotated phenotypes/gene/SNP terms can be used for exact match navigation. Both mapping modes support multiple phenotypes/gene/SNP search.
Do Mapping map the result to the RD map according to user input.
Result Detail trigger dialog box to display specific mapping information.
Take phenotype match mapping as an example:
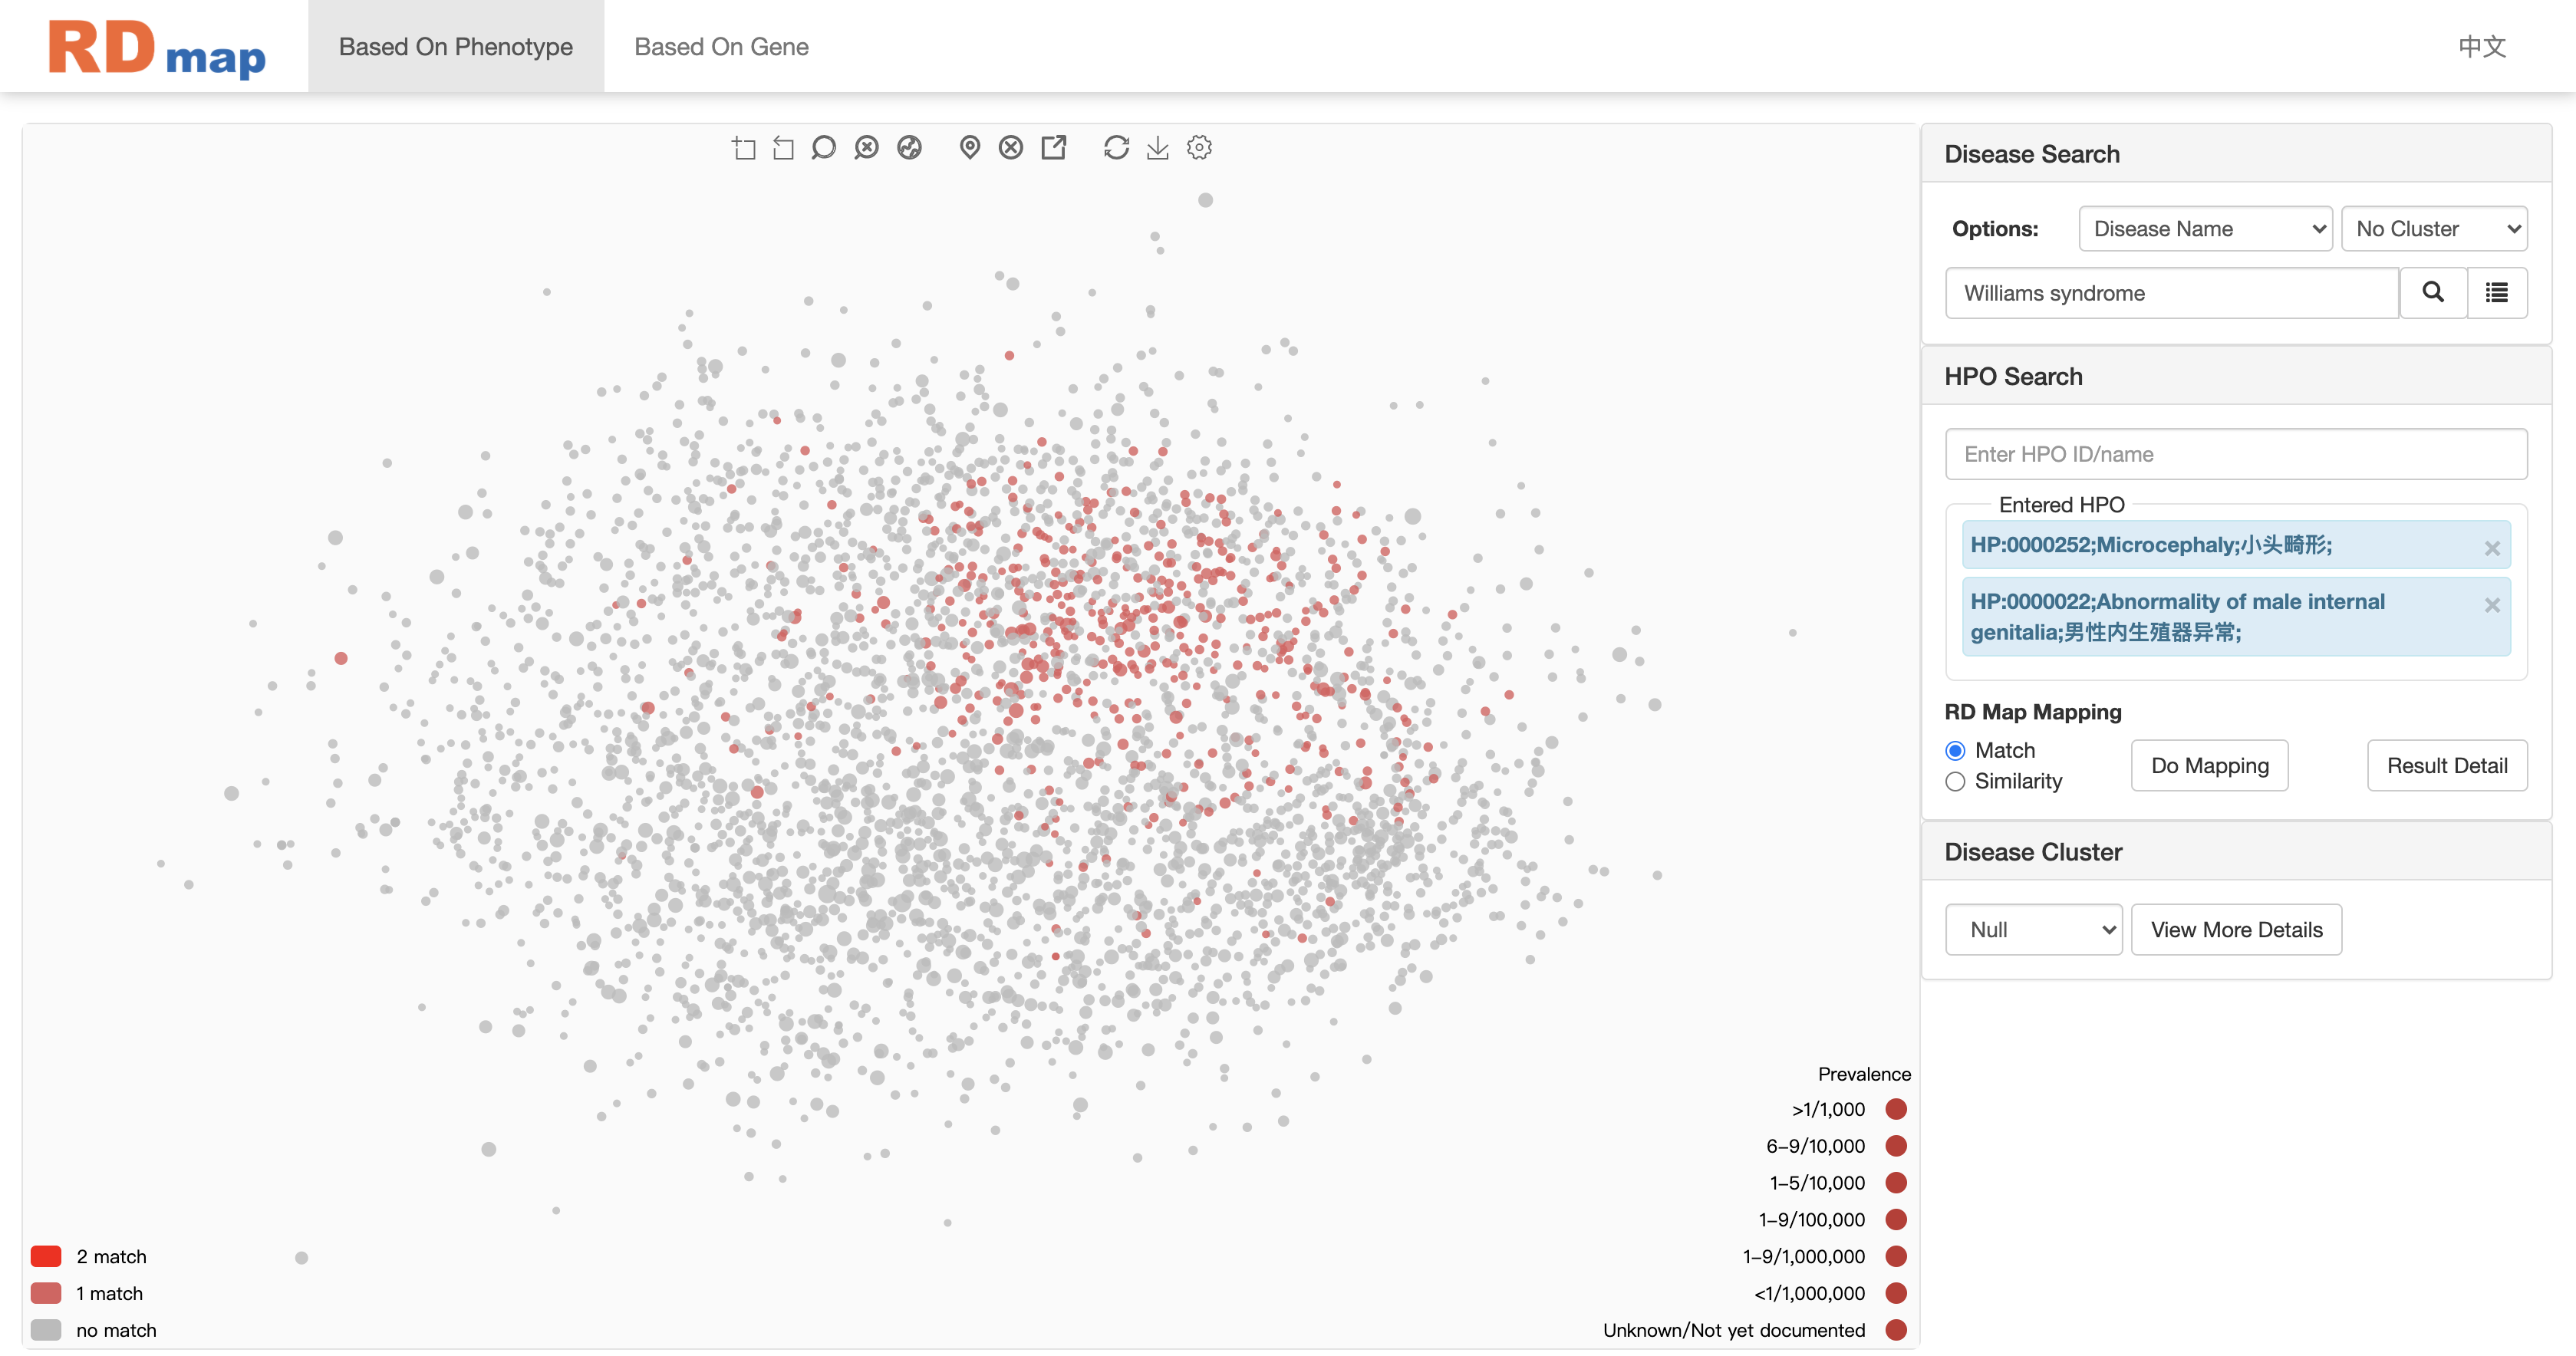
As shown in figure above, diseases matched with phenotypes will be highlighted on the RDmap. The left bottom corner will show legends show how many terms were matched, it can also be used to filter the mapping results by click on the legend (the corresponding disease will hide or show on RD map).
User can filter the results by clicking the icon at the bottom left of the map.
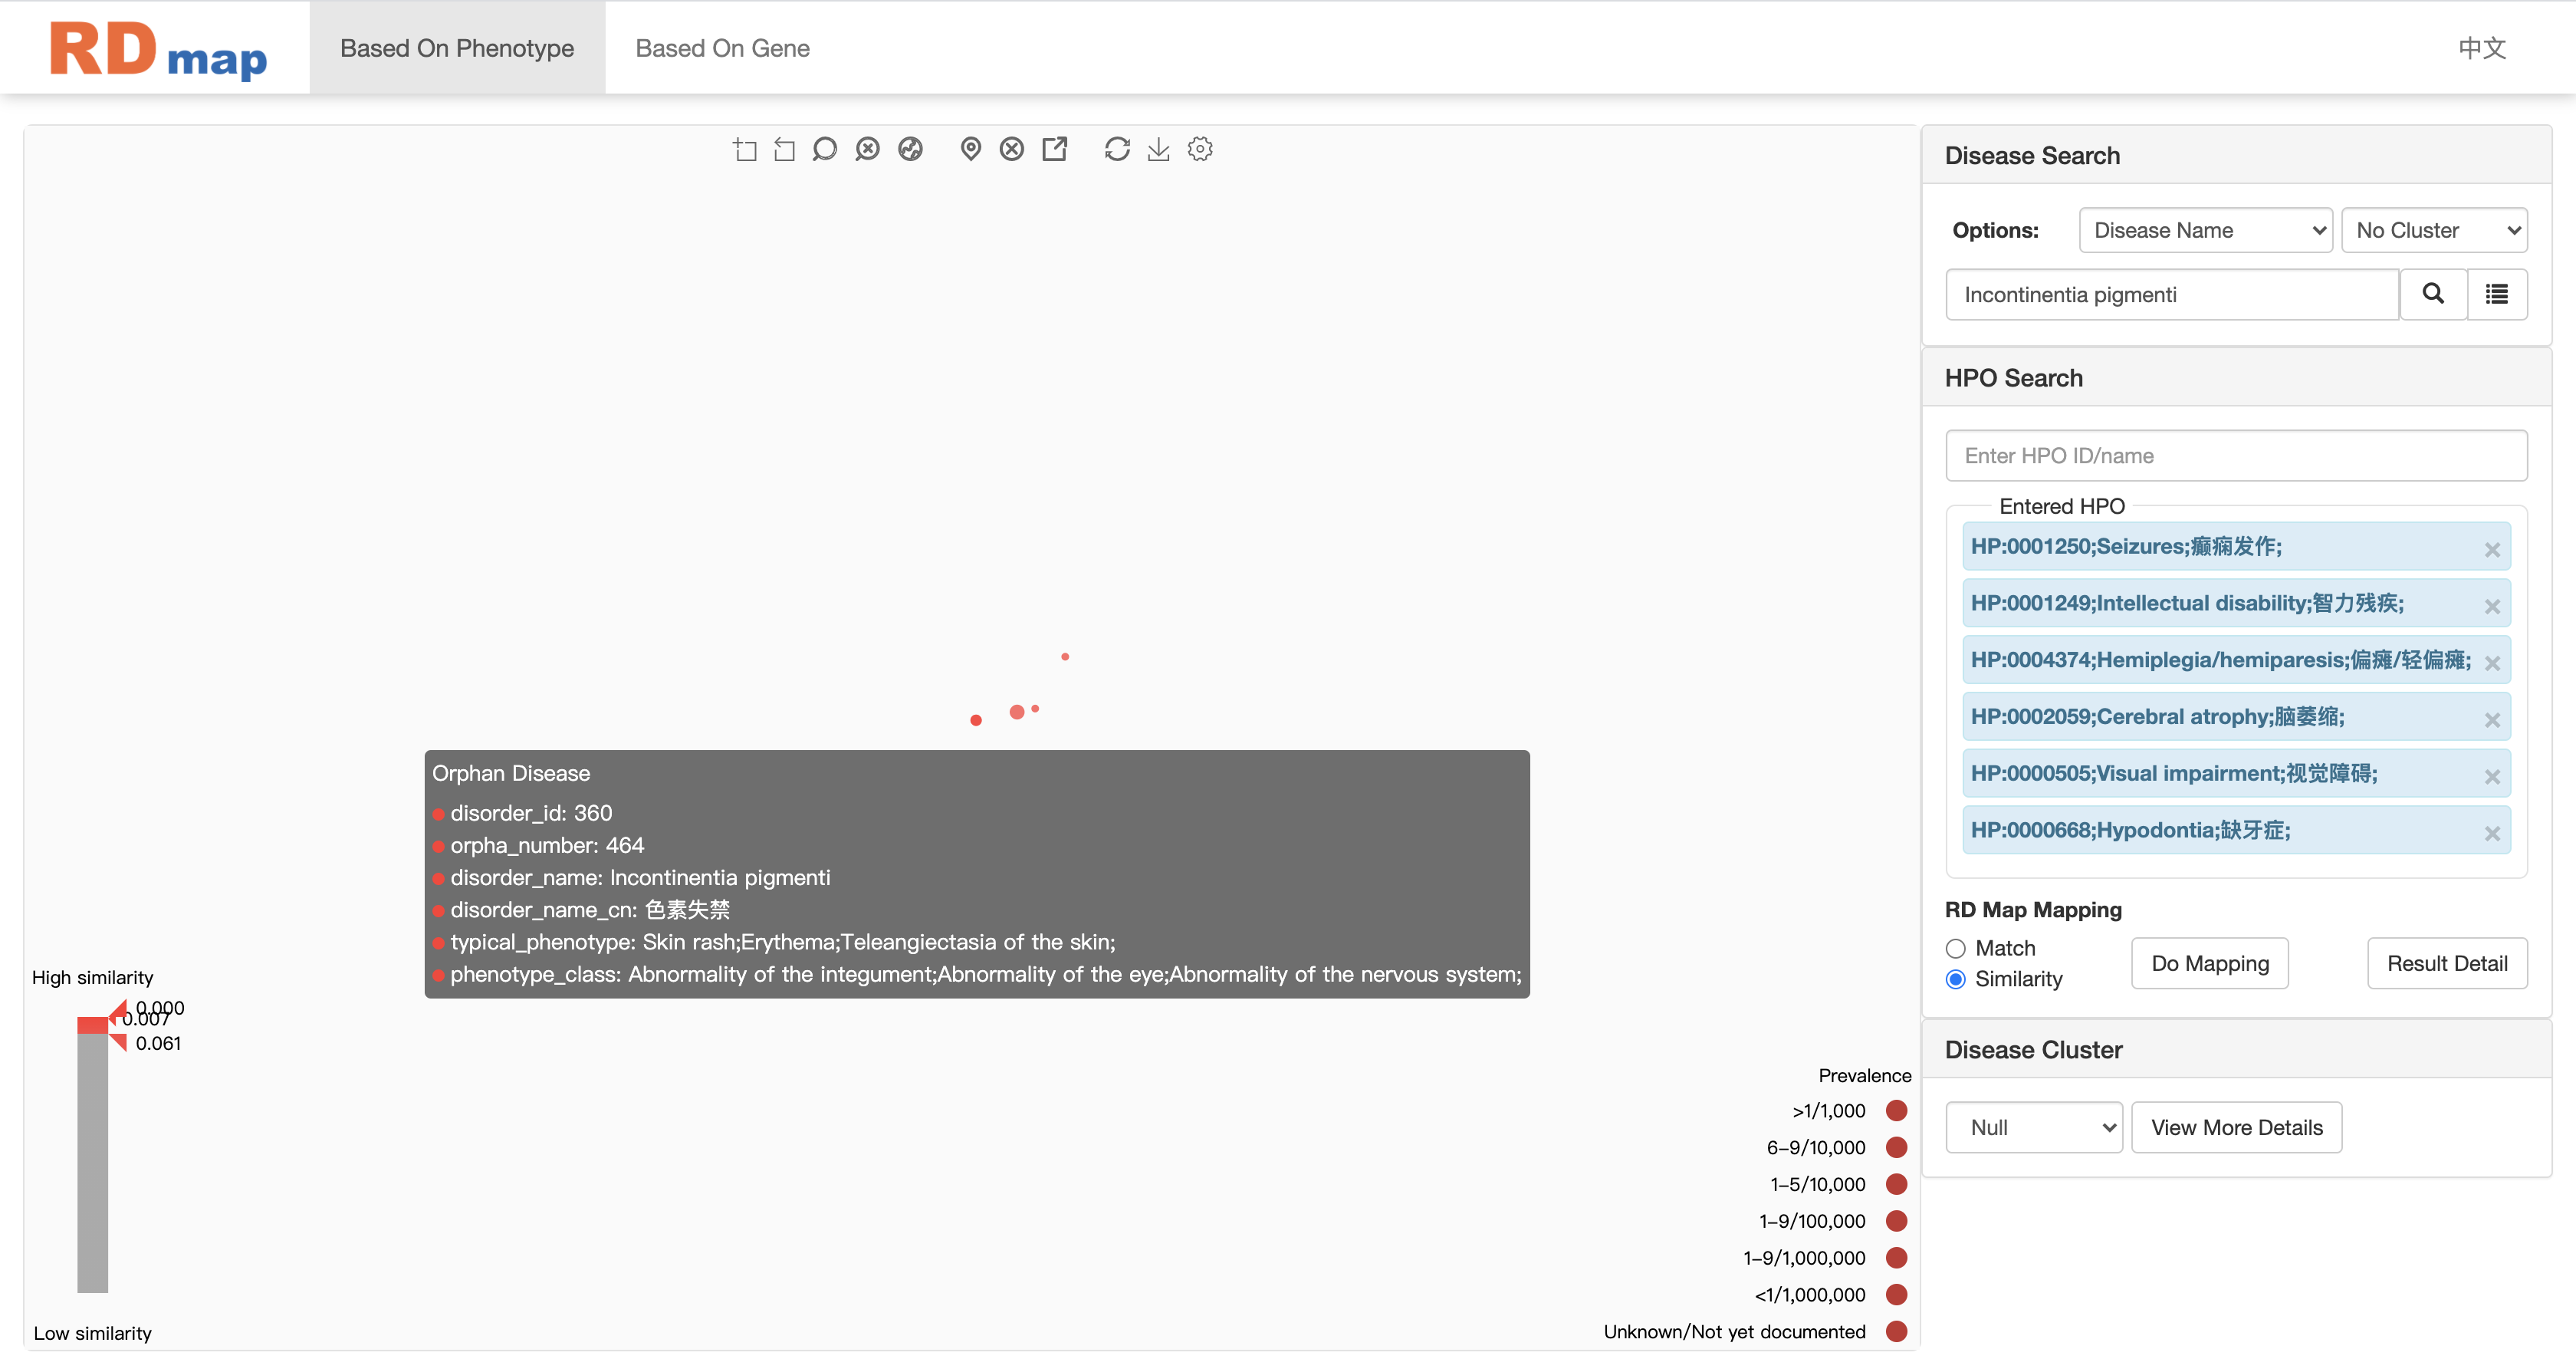
Take phenotype similarity mapping as an example:
In the similarity mapping, all diseases on the map will be colored by the similarity score between the searching phenotypes as shown in figure above. The darker of the red color means more similar diseases. The similarity mapping will also show a range slider on the low left corner. User can filter the diseases through adjusting the similarity score range on the slider as shown in figure below. Only several potential diseases will be left after the filtering. User can check the detail information of disease by click on the disease on RD map or click the detail information button of selected disease depending on the setting of RD map.
This function needs to call the background python script for calculation, which usually takes tens of seconds.
User can filter the results by dragging the icons at the bottom left of the map.
Disease Clusterclustering based on phenotype/genotype characteristics
Take phenotype-based RD map as an example:
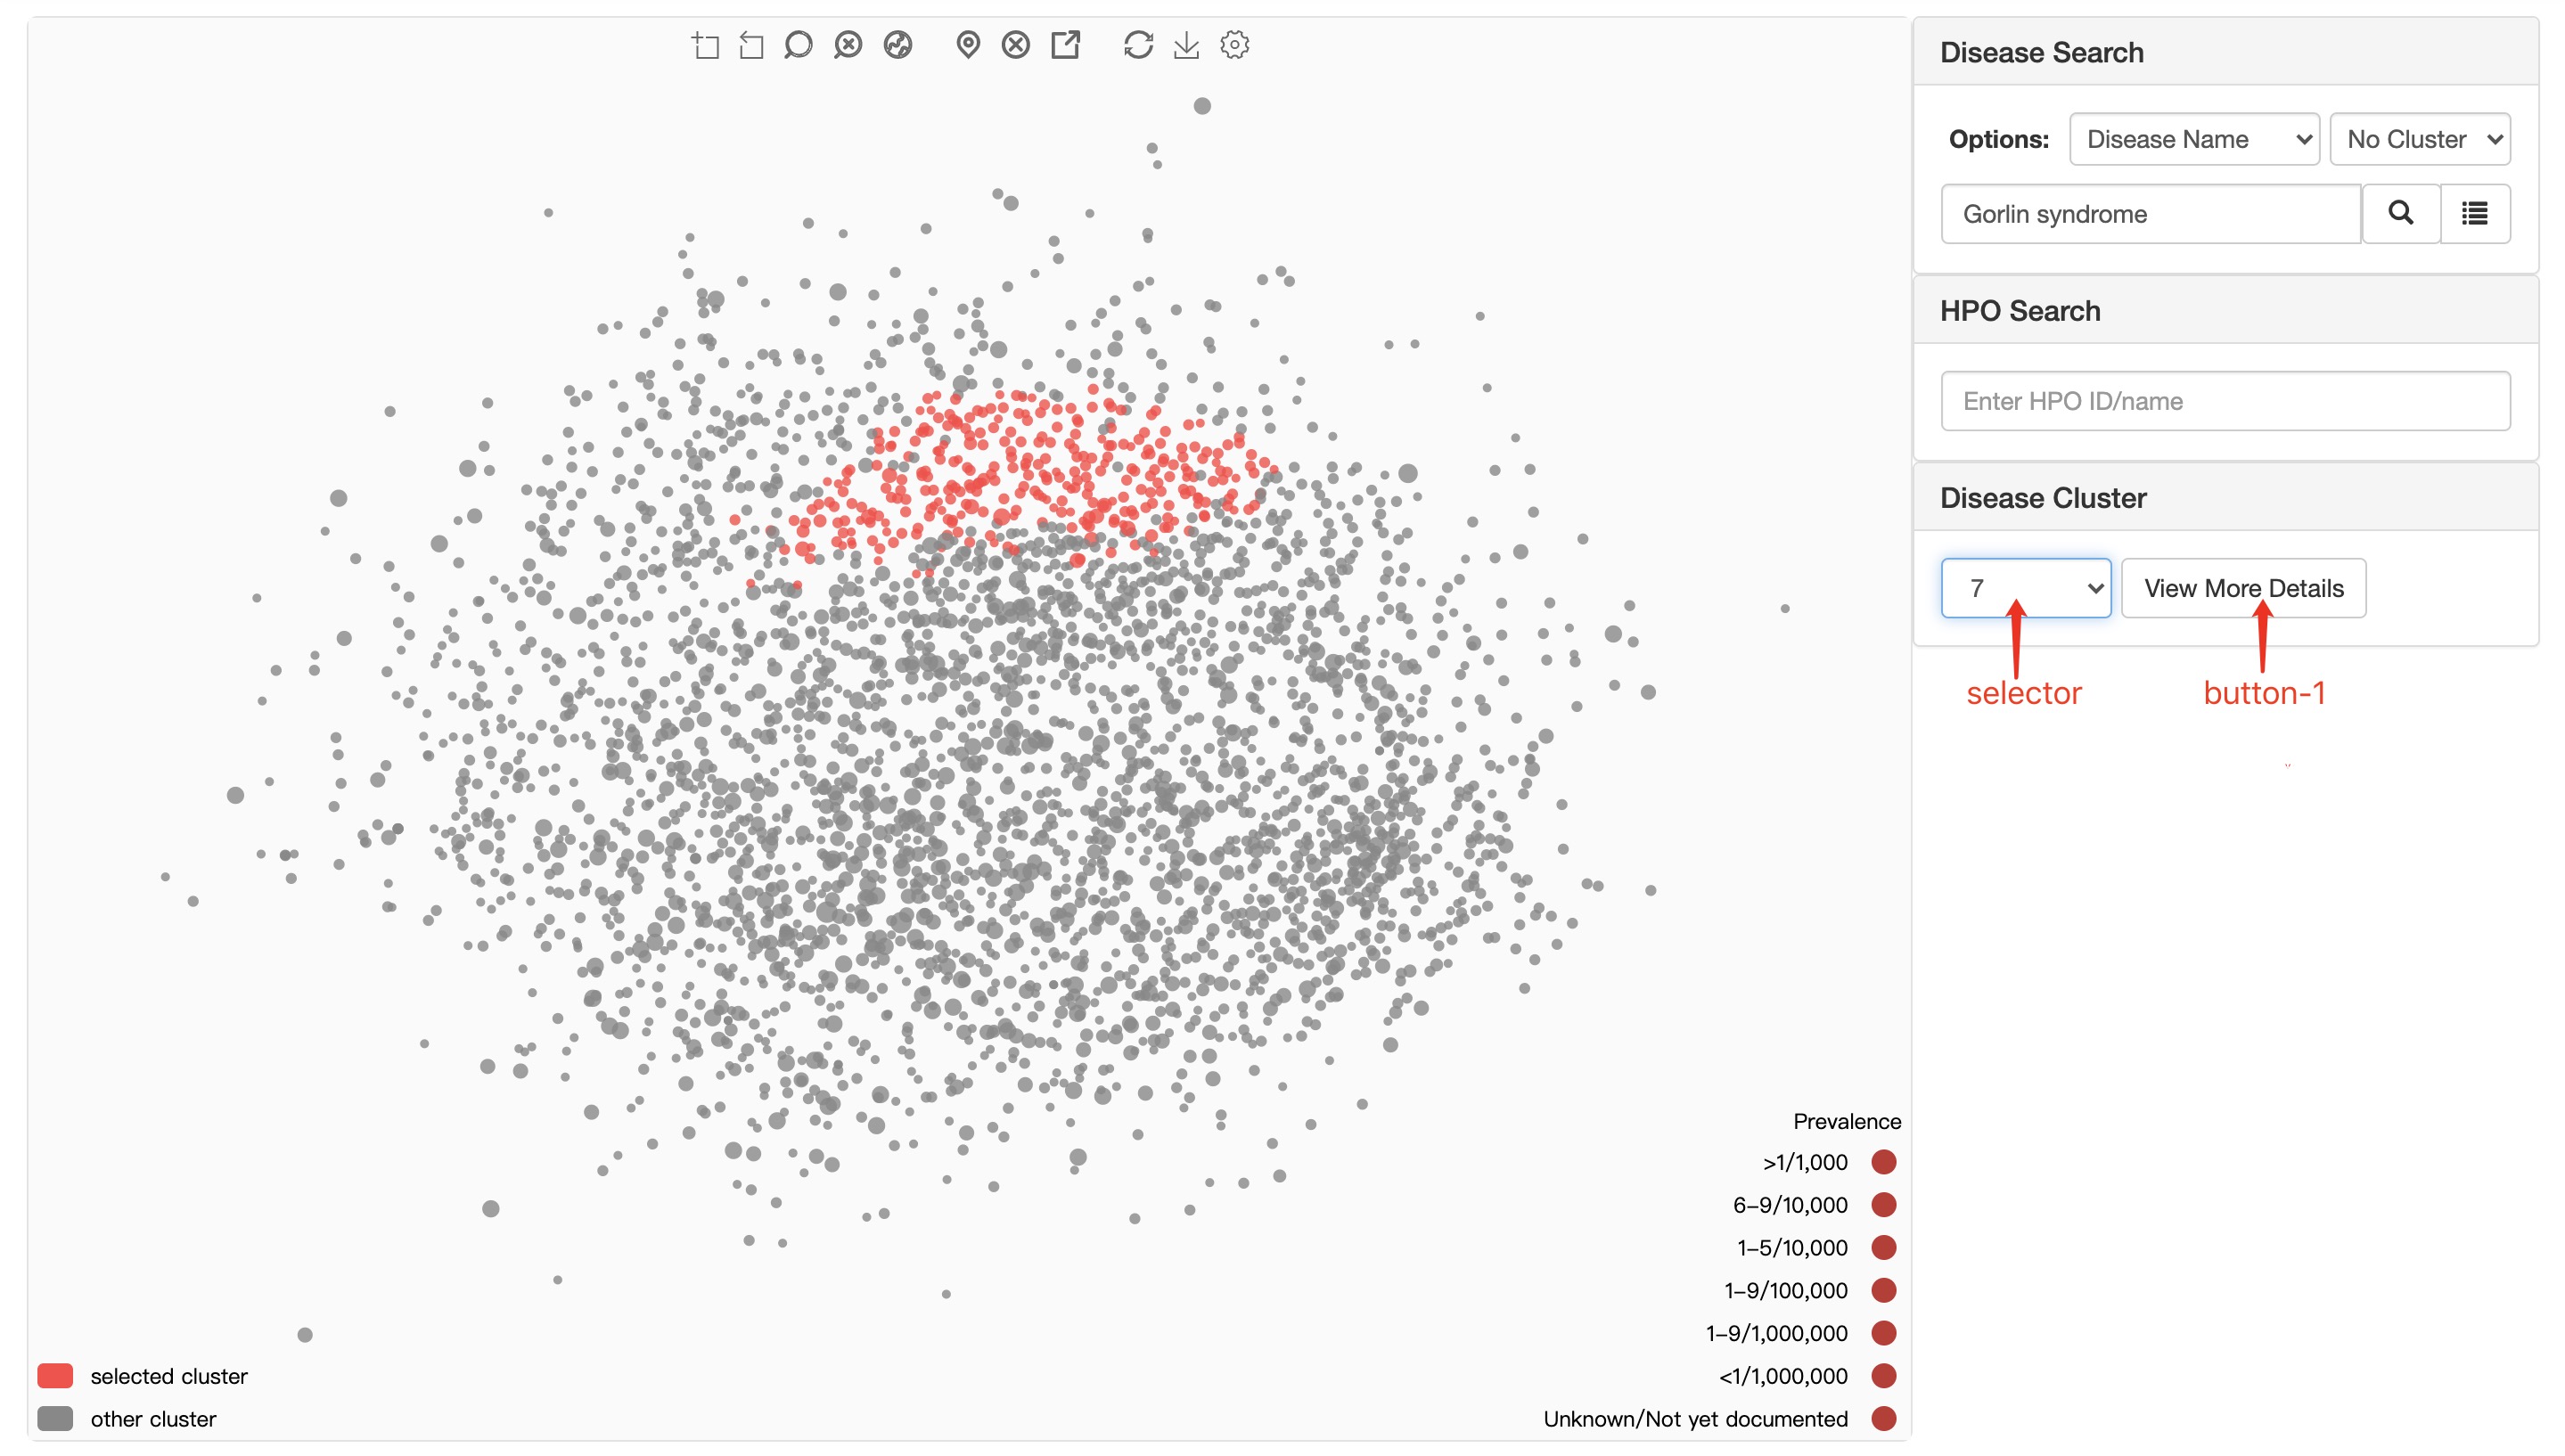
selector select specific cluster.
button-1 display the Rare Disease Cluster Details of selected cluster.
Take phenotype-based RD map as an example:
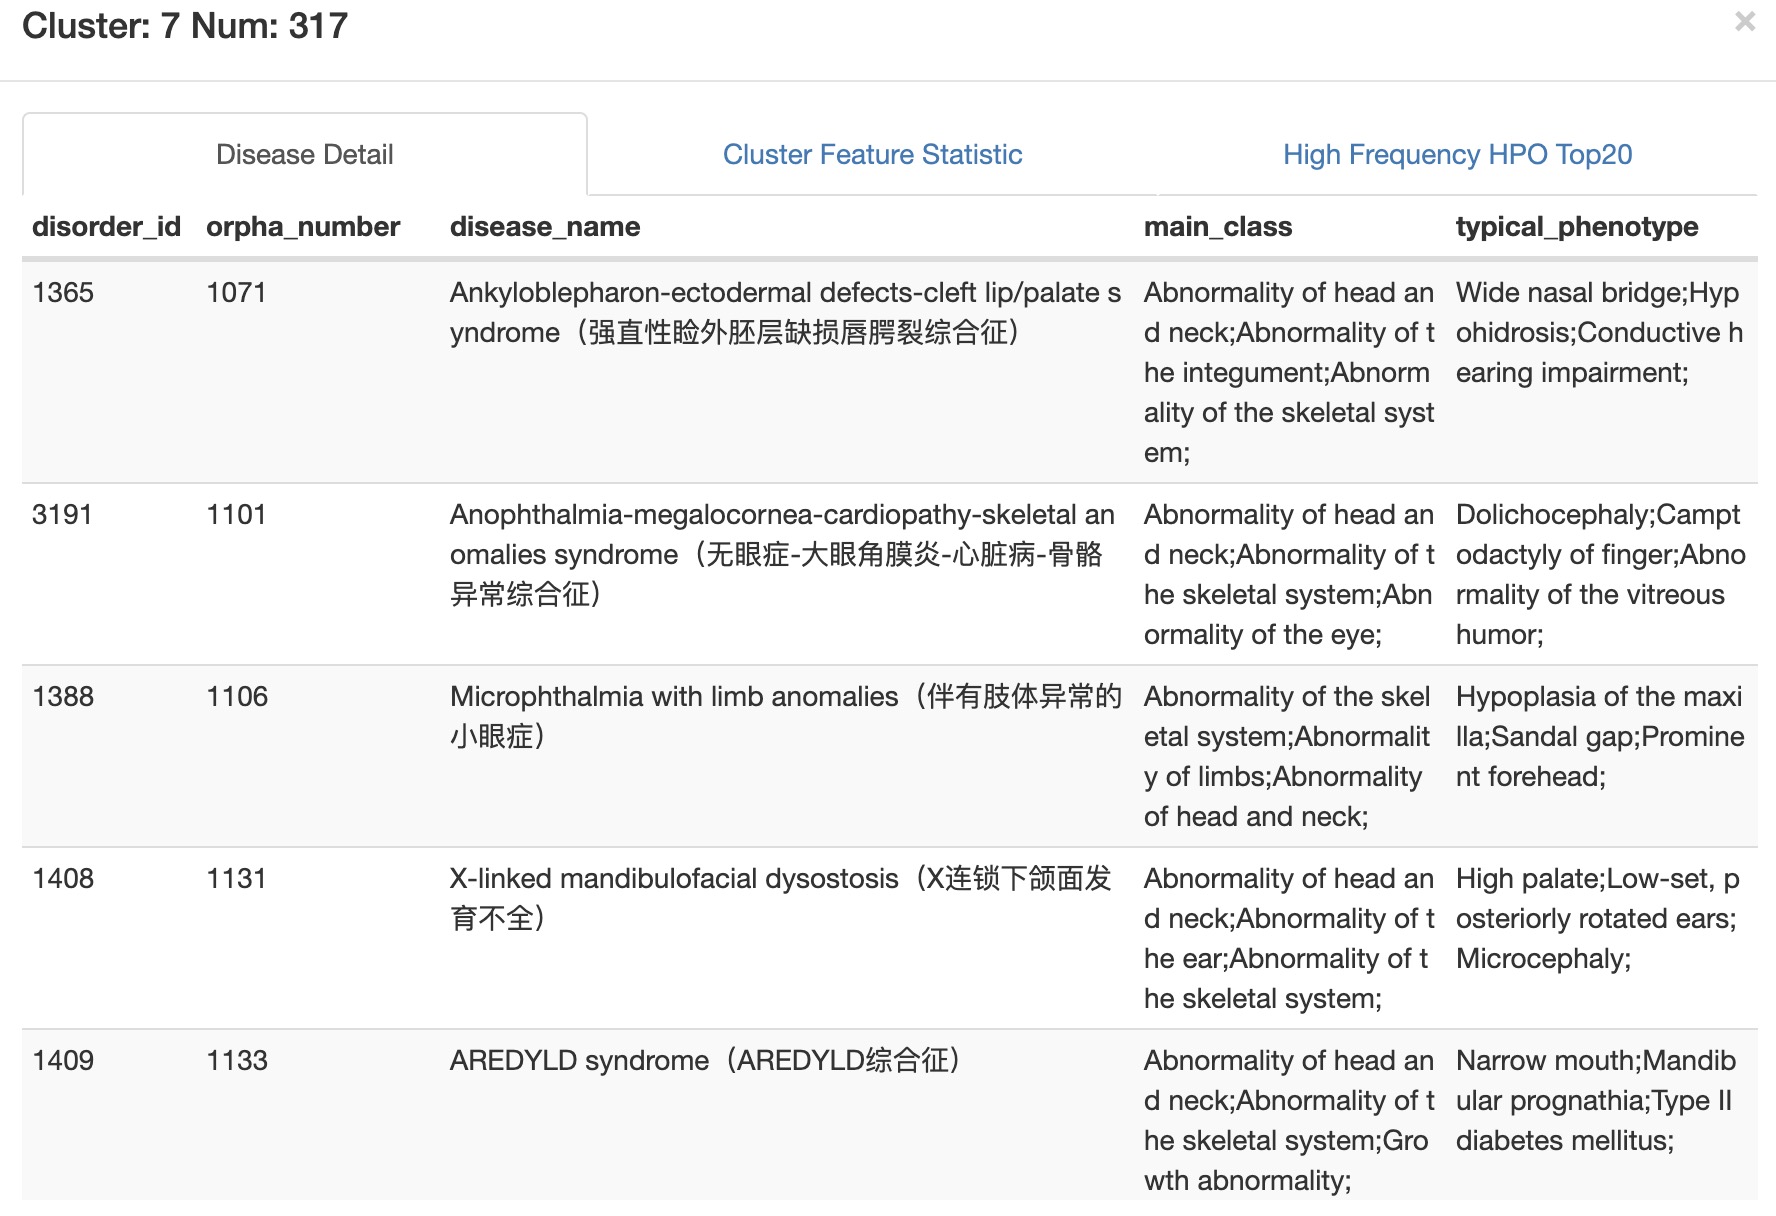

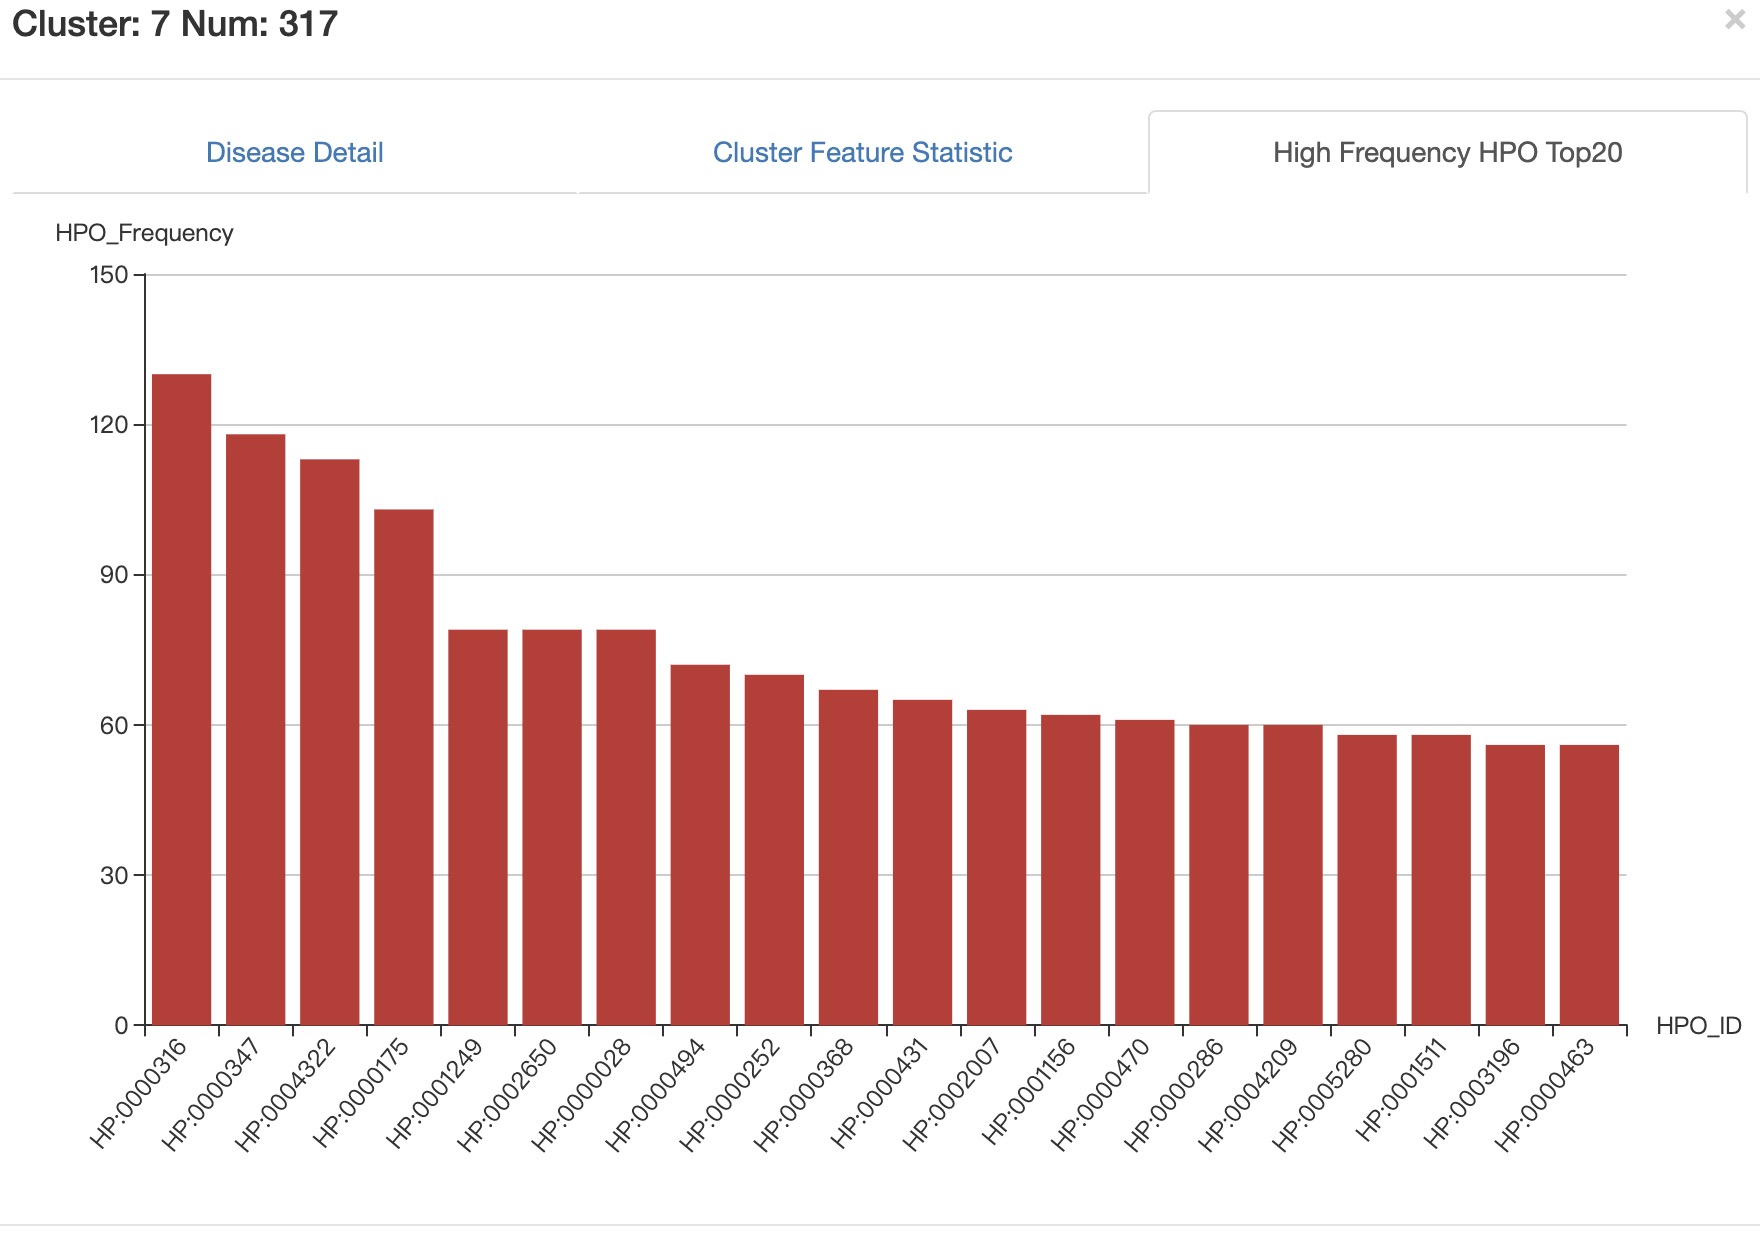
Disease Detail all diseases in selected cluster and their brief information.
Cluster Feature Statistic statistics of phenotypic characteristics of all diseases in selected cluster.
High Frequency HPO Top20 Top20 high frequency phenotypes of all diseases in selected cluster.
Disease Contentdisease details
Take phenotype-based RD map as an example:
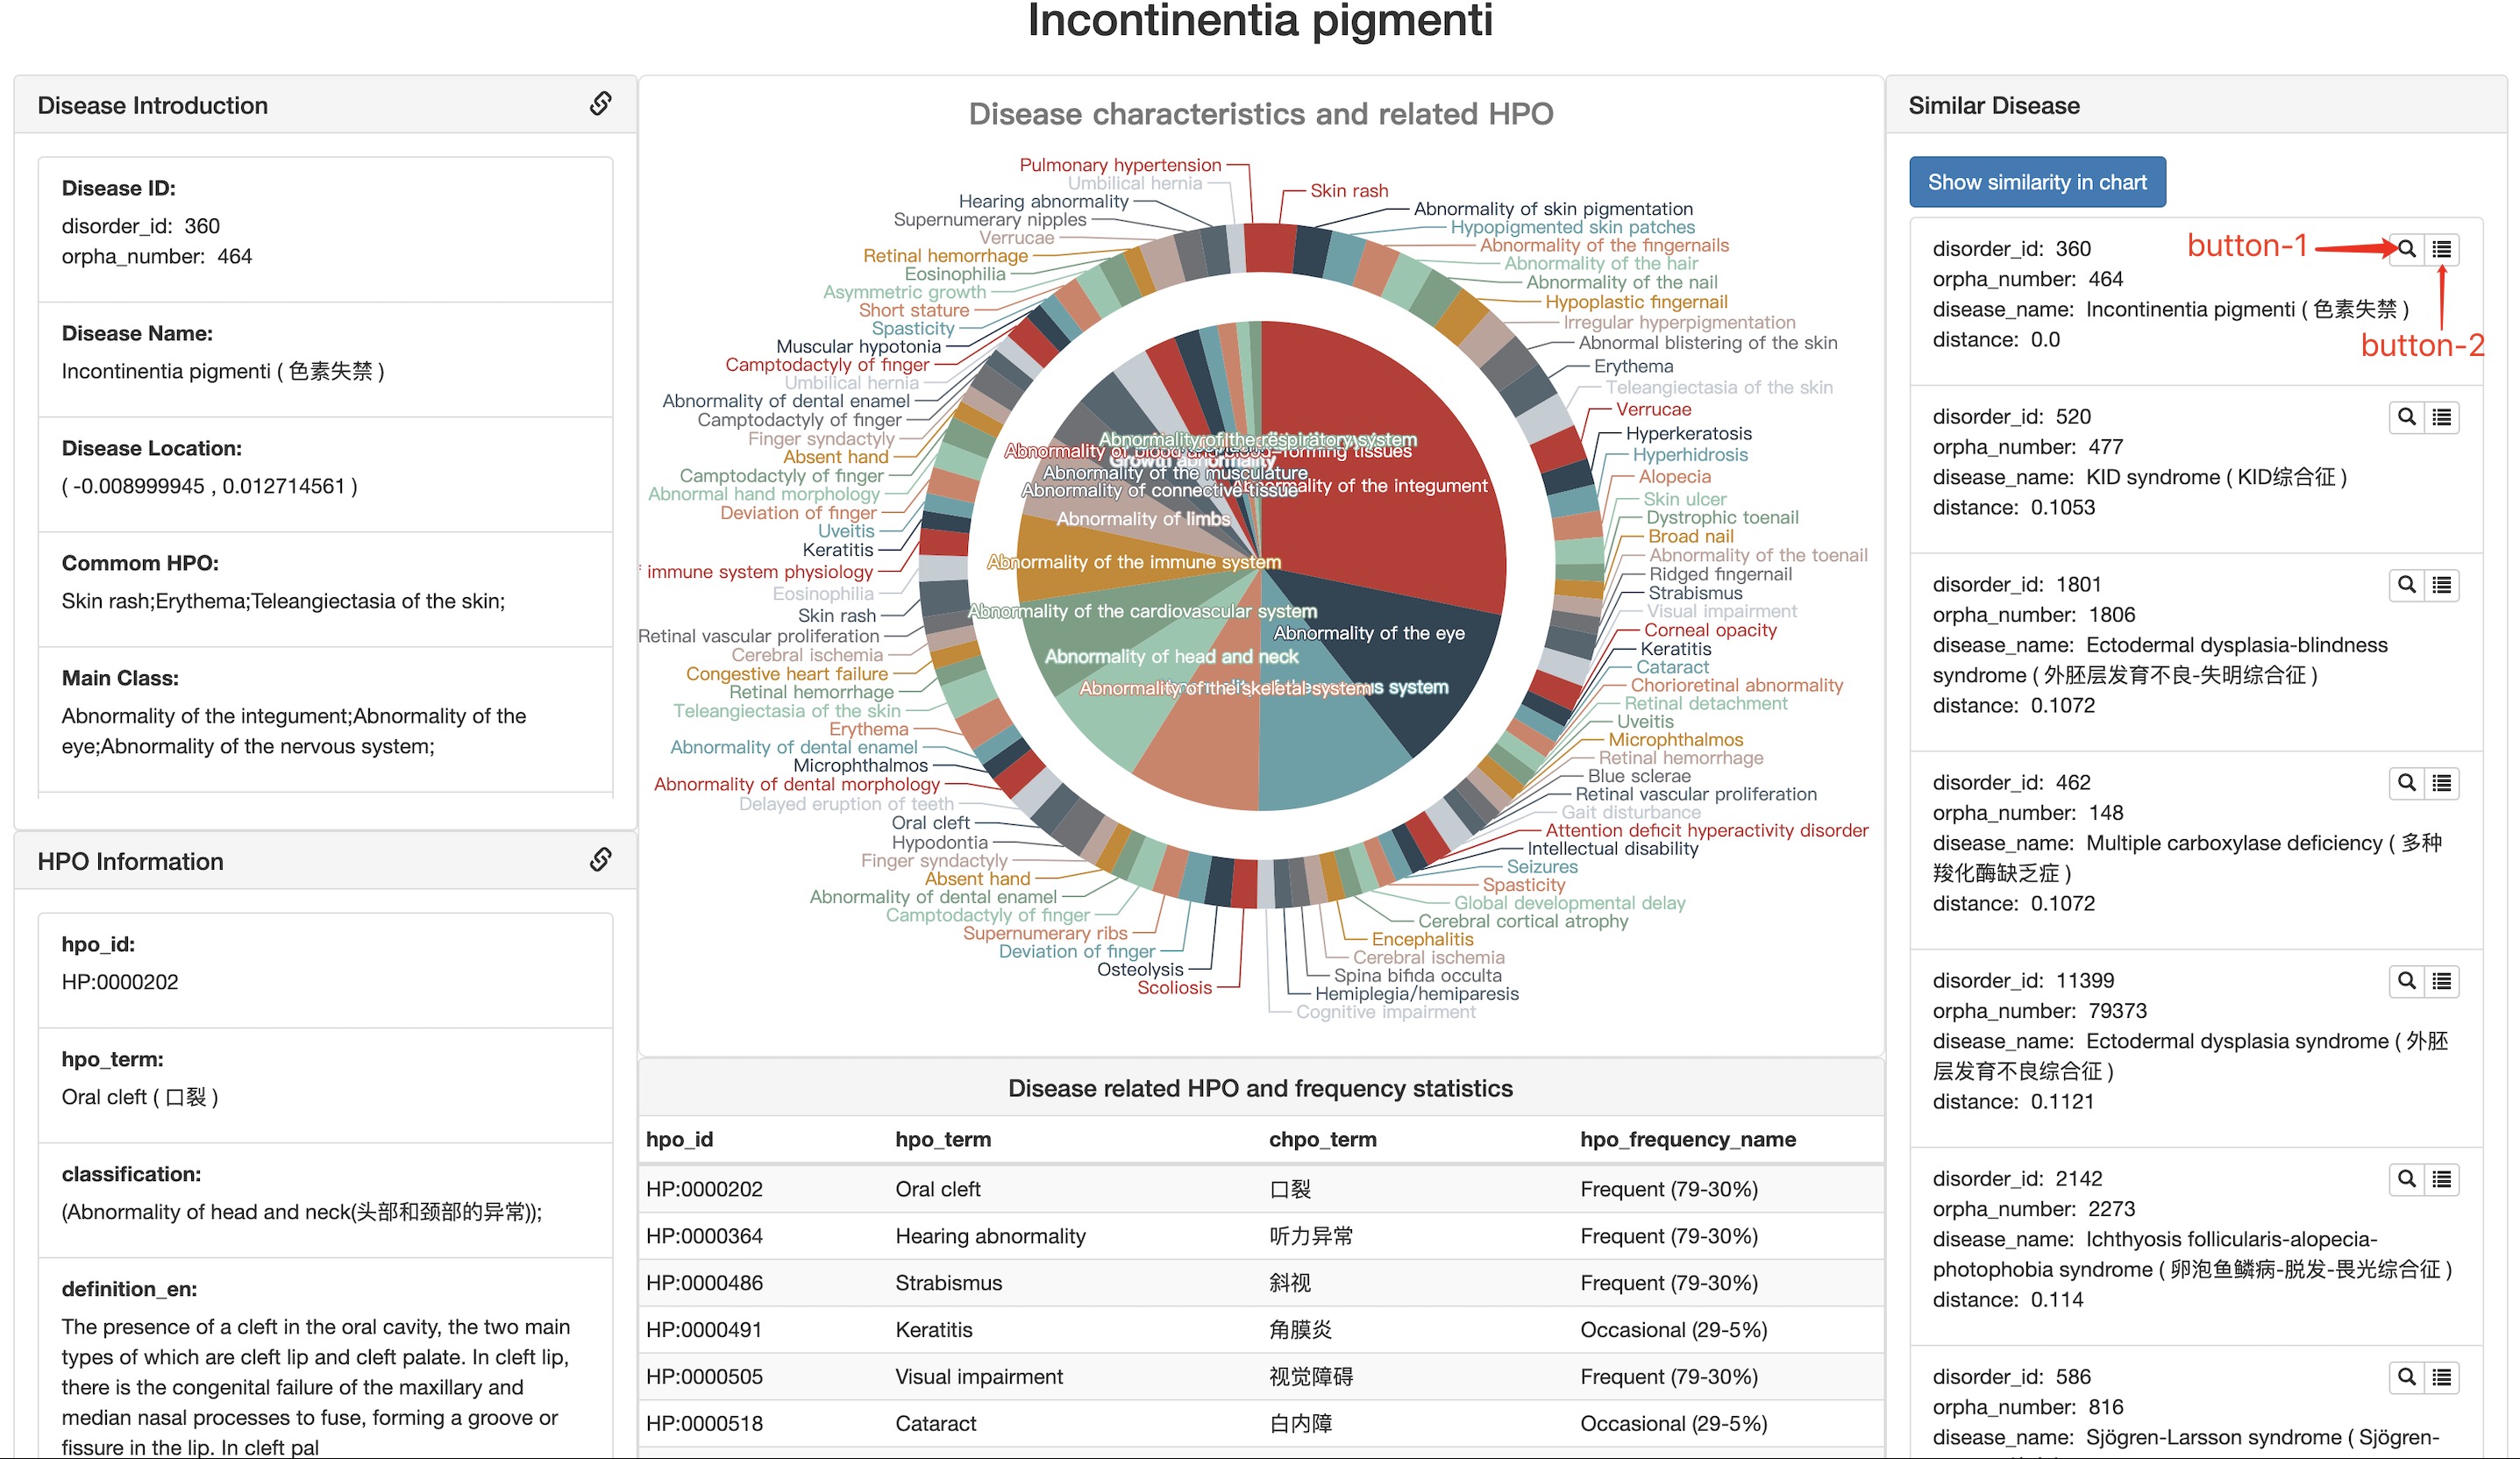
The detail phenotypes will be shown in a pie chart and list view. Click on the phenotype terms will show the detail definition of the HPO terms. The similar diseases of the target disease also shown as a list on the right (If it is not displayed, please click the Get similar disease button first.) and these diseases can also show on RDmap by click the button Show similarity in chart.
Get similar disease get a list of similar diseases of the selected disease. This function needs to call the background python script for calculation, which usually takes a few seconds.
Show similarity in chart map the similar features between all rare diseases and selected diseases to RD map.
button-1 select the disease to which the button belongs in RD map.
button-2 show the detailed information about disease to which the button belongs.
All icons are linked to the source of evidence.
Download
All calculation related scripts are available on github.